| 4 spectra, STVPVR |
0.000 |
|
0.096 |
|
0.016 |
0.000 |
0.000 |
0.888 |
0.000 |
|
| 1 spectrum, ILTTNTWSSELSK |
0.000 |
|
0.158 |
|
0.109 |
0.000 |
0.000 |
0.733 |
0.000 |
|
| 4 spectra, LAANAFLAQR |
0.000 |
|
0.133 |
|
0.000 |
0.000 |
0.000 |
0.867 |
0.000 |
|
| 2 spectra, ASVGFGGSCFQK |
0.000 |
|
0.000 |
|
0.000 |
0.000 |
0.000 |
1.000 |
0.000 |
|
| 5 spectra, ELDYER |
0.000 |
|
0.051 |
|
0.000 |
0.000 |
0.000 |
0.949 |
0.000 |
|
| 2 spectra, IAILGFAFK |
0.000 |
|
0.100 |
|
0.050 |
0.000 |
0.000 |
0.849 |
0.000 |
|
| 3 spectra, EVVESCR |
0.000 |
|
0.082 |
|
0.000 |
0.000 |
0.000 |
0.918 |
0.000 |
|
| 1 spectrum, MLKPAFIFDGR |
0.052 |
|
0.100 |
|
0.000 |
0.000 |
0.083 |
0.764 |
0.000 |
|
| 1 spectrum, ESSSIYISK |
0.000 |
|
0.000 |
|
0.027 |
0.000 |
0.000 |
0.973 |
0.000 |
|
| 2 spectra, YLMDEGAHLHIYDPK |
0.000 |
|
0.171 |
|
0.000 |
0.000 |
0.000 |
0.829 |
0.000 |
|
| 1 spectrum, AVQALCAVYEHWVPK |
0.000 |
|
0.000 |
|
0.000 |
0.000 |
0.000 |
1.000 |
0.000 |
|
| 12 spectra, EQIVVDLSHPGVSADDQVSR |
0.000 |
|
0.058 |
|
0.078 |
0.000 |
0.000 |
0.864 |
0.000 |
|
| 8 spectra, NLFFSTNIDDAIR |
0.000 |
|
0.001 |
|
0.035 |
0.000 |
0.000 |
0.964 |
0.000 |
|
| 7 spectra, VTVVDVNEAR |
0.000 |
|
0.085 |
|
0.021 |
0.000 |
0.000 |
0.894 |
0.000 |
|
| 1 spectrum, VLIGGDETPEGQR |
0.000 |
|
0.104 |
|
0.000 |
0.000 |
0.050 |
0.846 |
0.000 |
|
| 1 spectrum, EADLVFISVNTPTK |
0.000 |
|
0.228 |
|
0.000 |
0.000 |
0.000 |
0.772 |
0.000 |
|
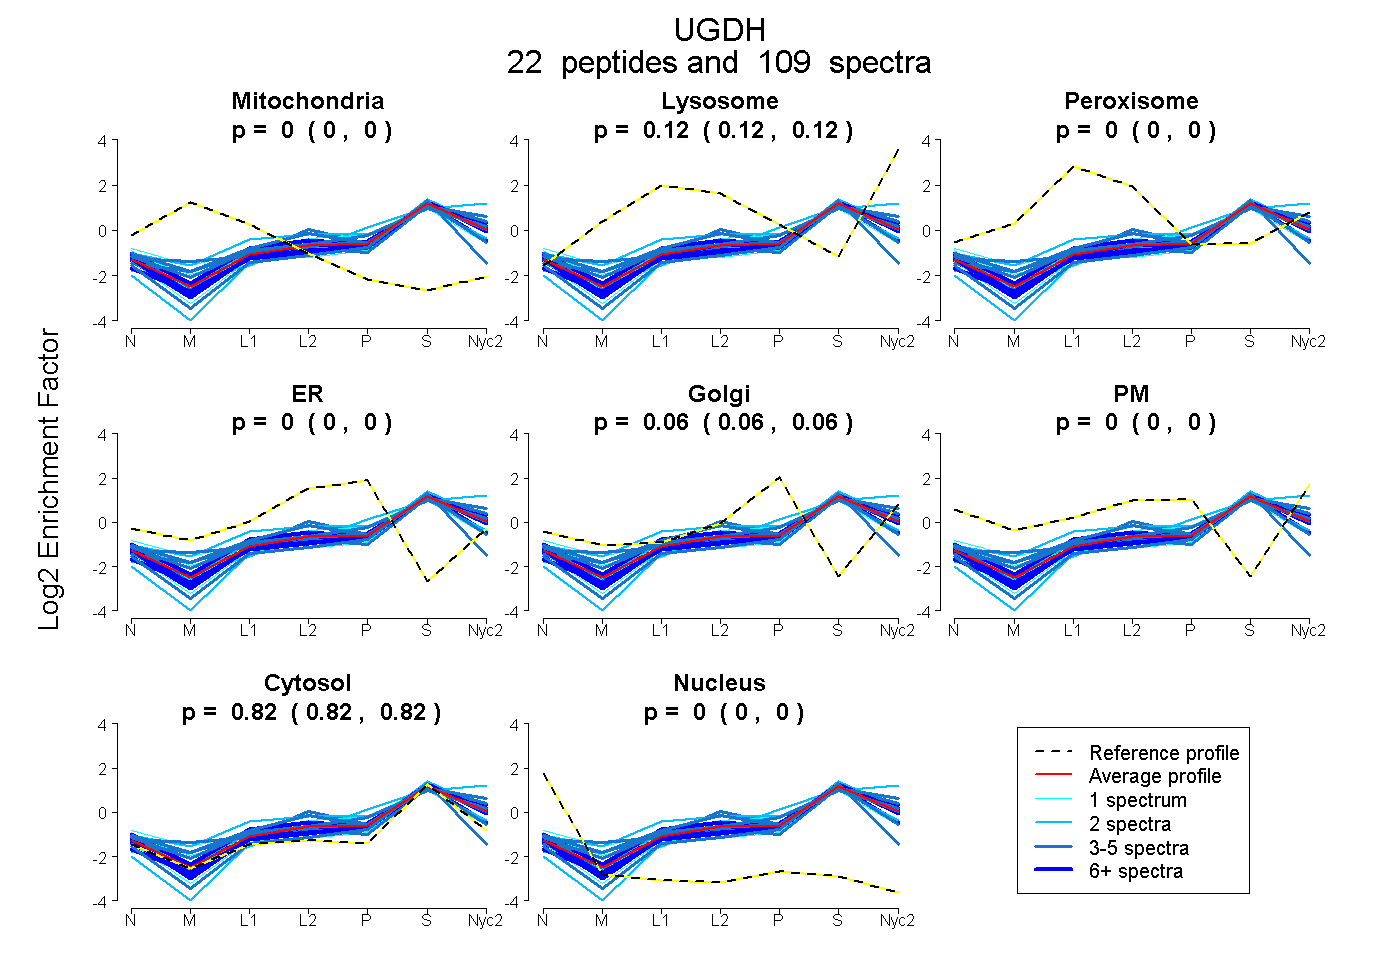
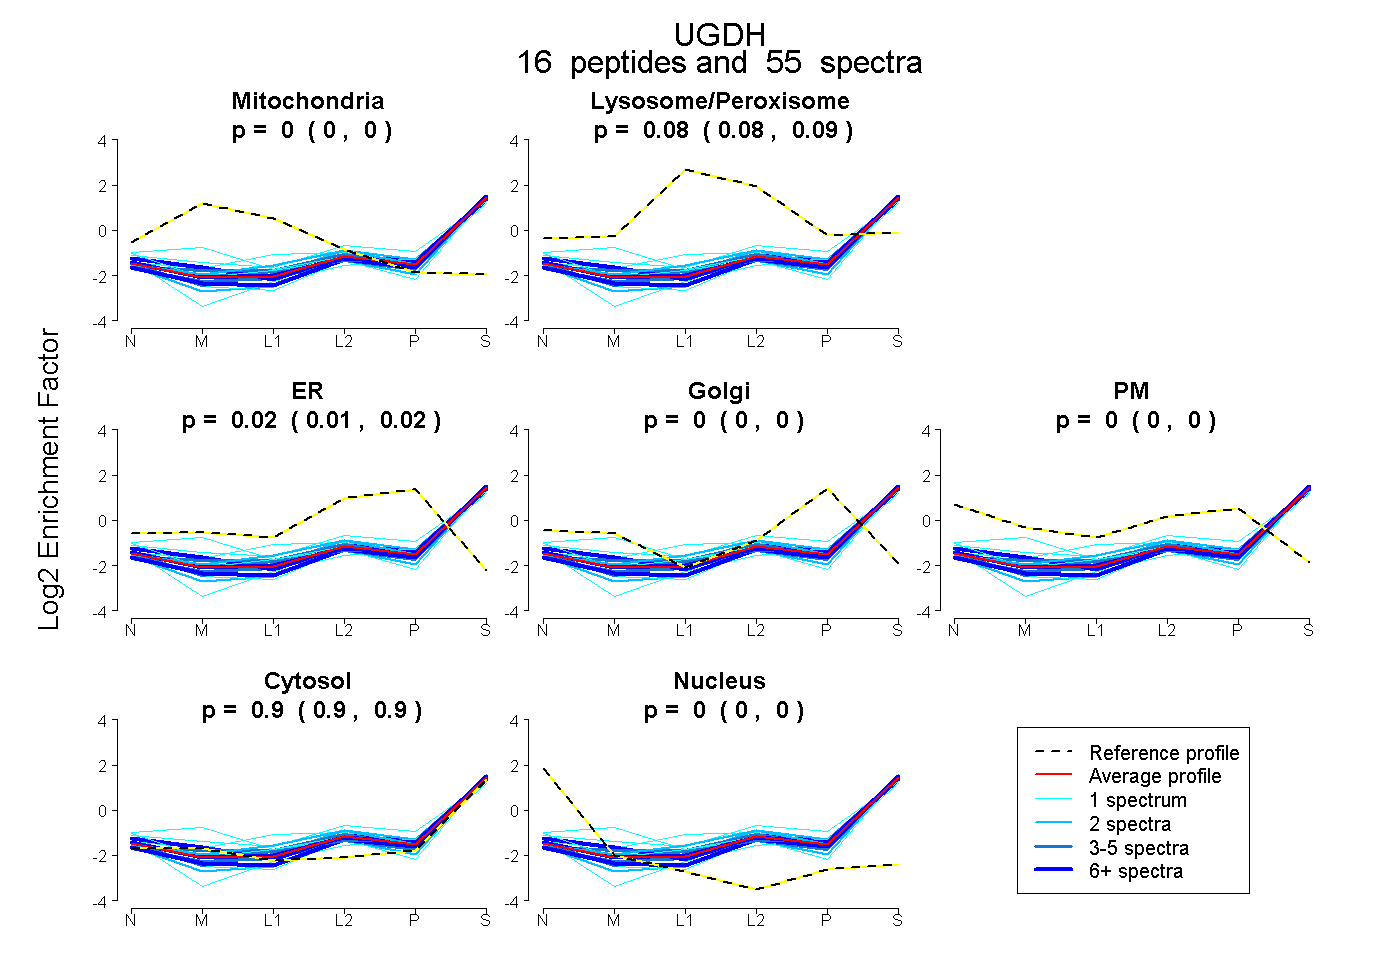
 22
22