 24
24peptides
spectra
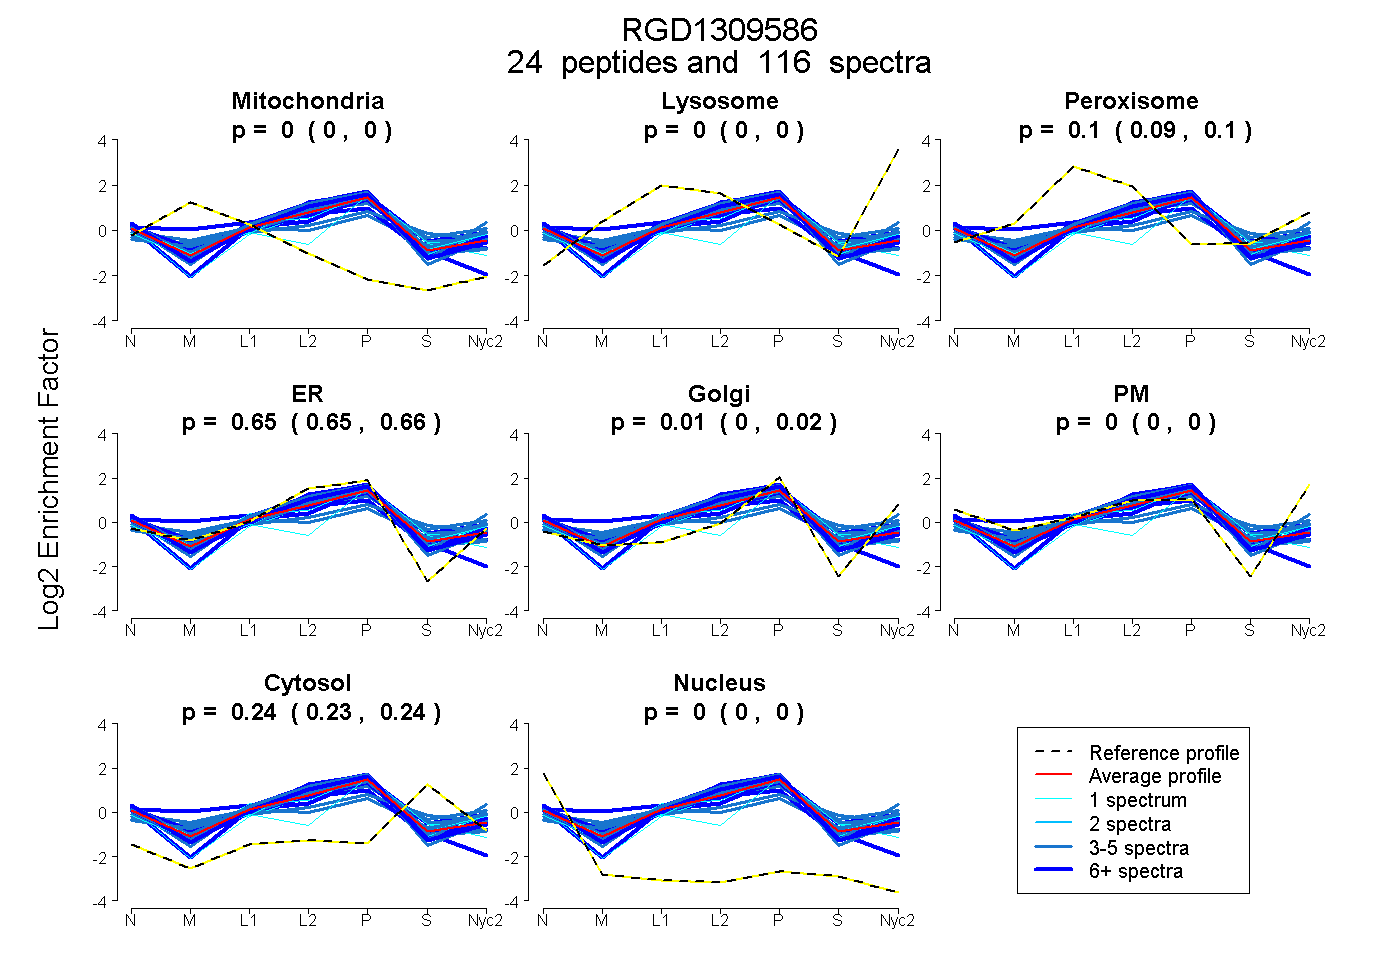
0.000 | 0.000
0.000 | 0.000
0.094 | 0.100
0.645 | 0.664
0.000 | 0.017
0.000 | 0.000
0.235 | 0.240
0.000 | 0.000
19peptides
spectra

0.000 | 0.000
0.361 | 0.375
0.274 | 0.300
0.308 | 0.330
0.014 | 0.031
0.000 | 0.000
0.000 | 0.000
25peptides
spectra
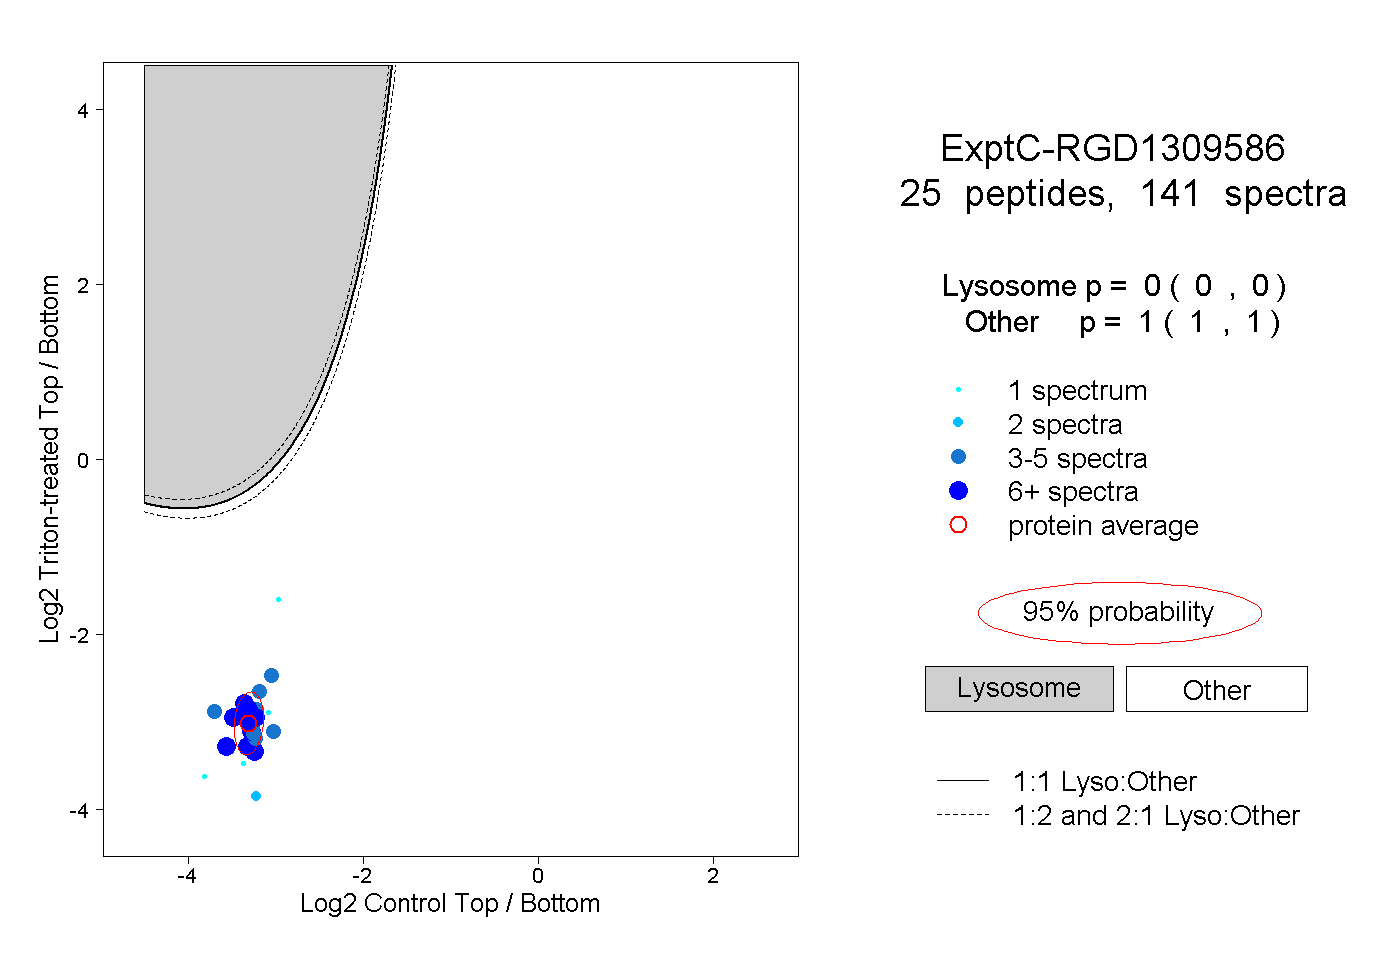
0.000 | 0.000
1.000 | 1.000
6peptides
spectra
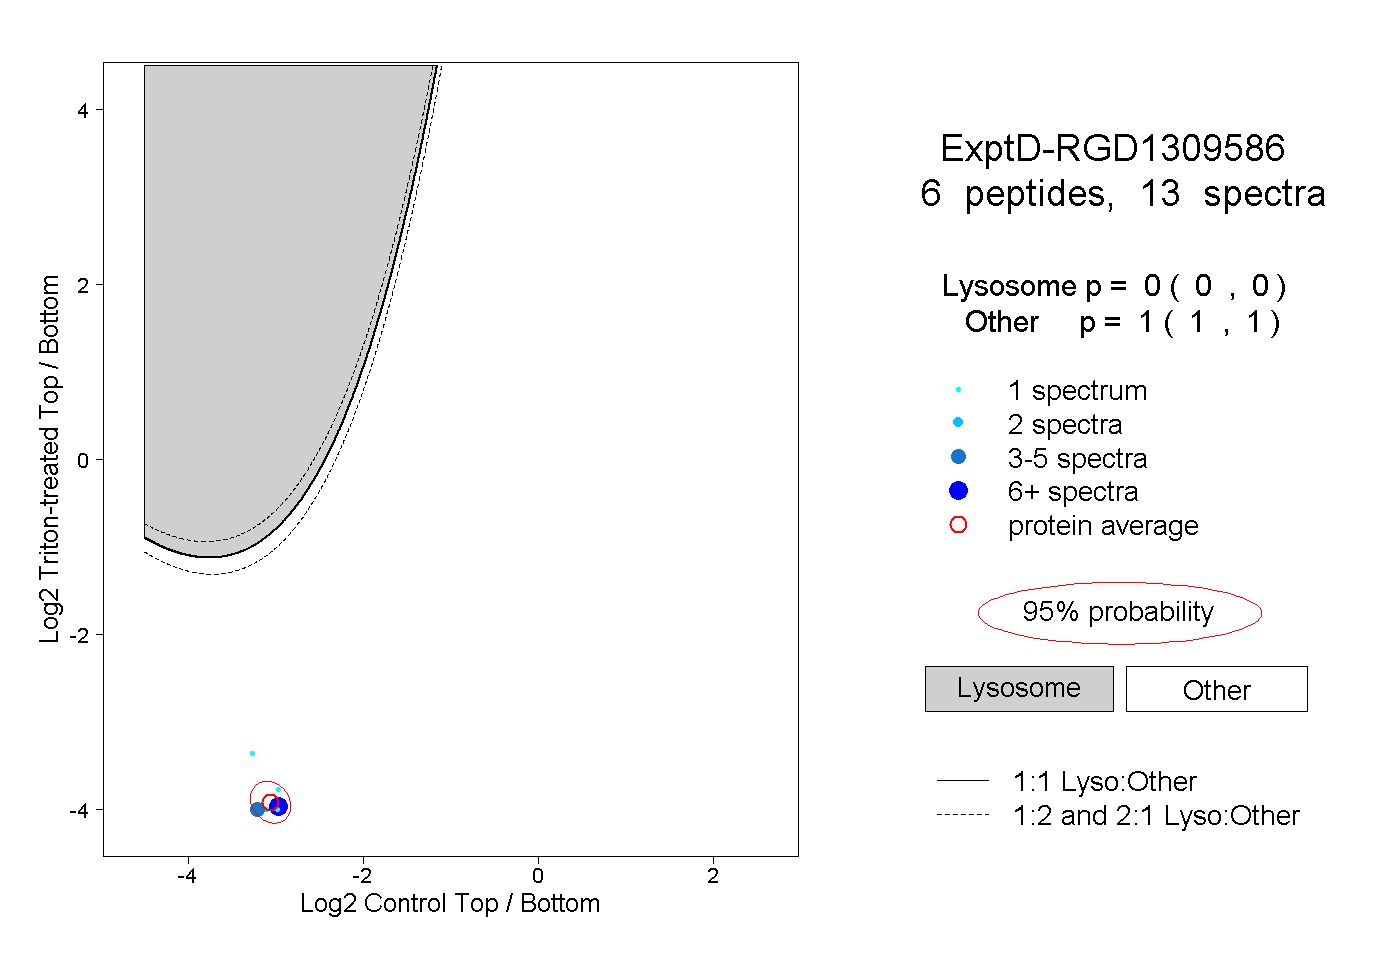
0.000 | 0.000
1.000 | 1.000