 15
15peptides
spectra

0.000 | 0.000
0.037 | 0.103
0.000 | 0.000
0.000 | 0.000
0.000 | 0.000
0.413 | 0.485
0.242 | 0.281
0.191 | 0.231
6peptides
spectra
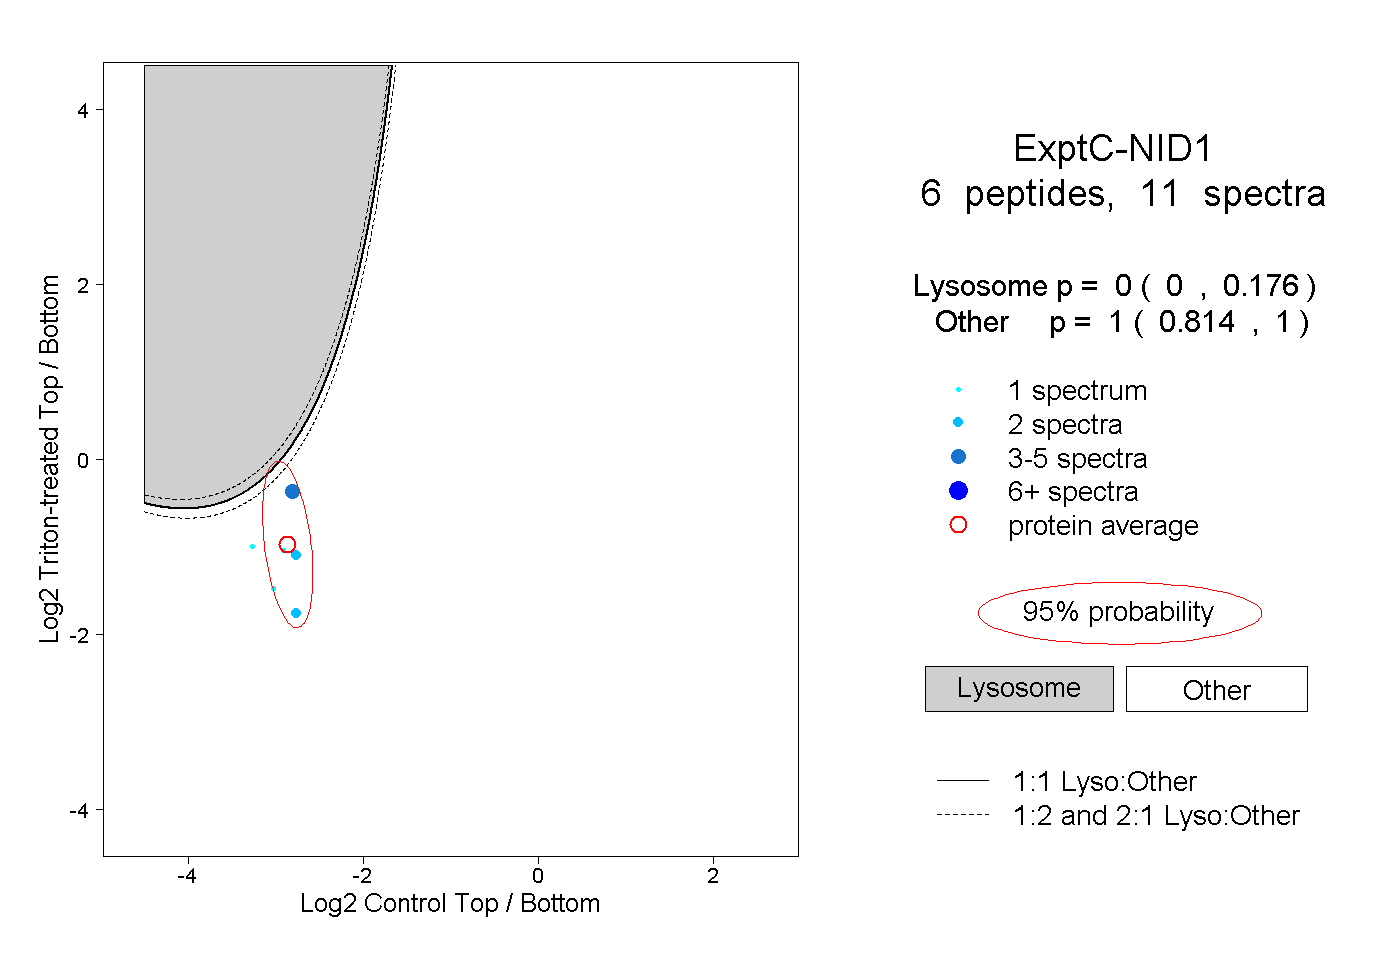
0.000 | 0.176
0.814 | 1.000
1peptide
spectra
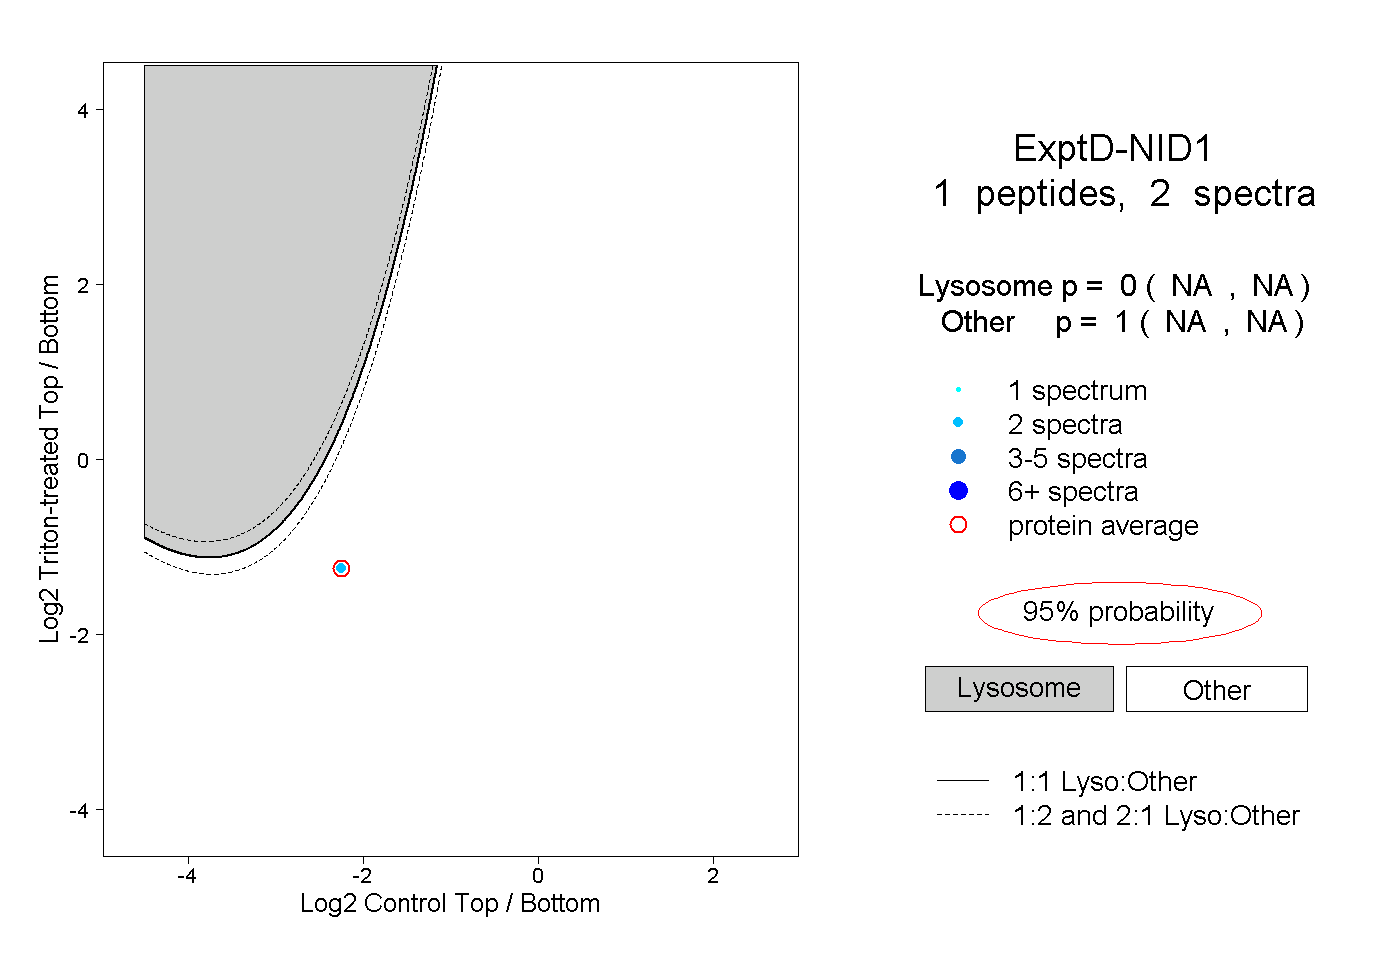
NA | NA
NA | NA