 15
15peptides
spectra

0.000 | 0.000
0.037 | 0.103
0.000 | 0.000
0.000 | 0.000
0.000 | 0.000
0.413 | 0.485
0.242 | 0.281
0.191 | 0.231
6peptides
spectra
0.000 | 0.176
0.814 | 1.000
| Plot | Mito | Lyso | Perox | ER | Golgi | PM | Cytosol | Nucleus | |||||
| Expt A |
15 peptides |
25 spectra |
|
0.000 0.000 | 0.000 |
0.072 0.037 | 0.103 |
0.000 0.000 | 0.000 |
0.000 0.000 | 0.000 |
0.000 0.000 | 0.000 |
0.453 0.413 | 0.485 |
0.262 0.242 | 0.281 |
0.213 0.191 | 0.231 |
||
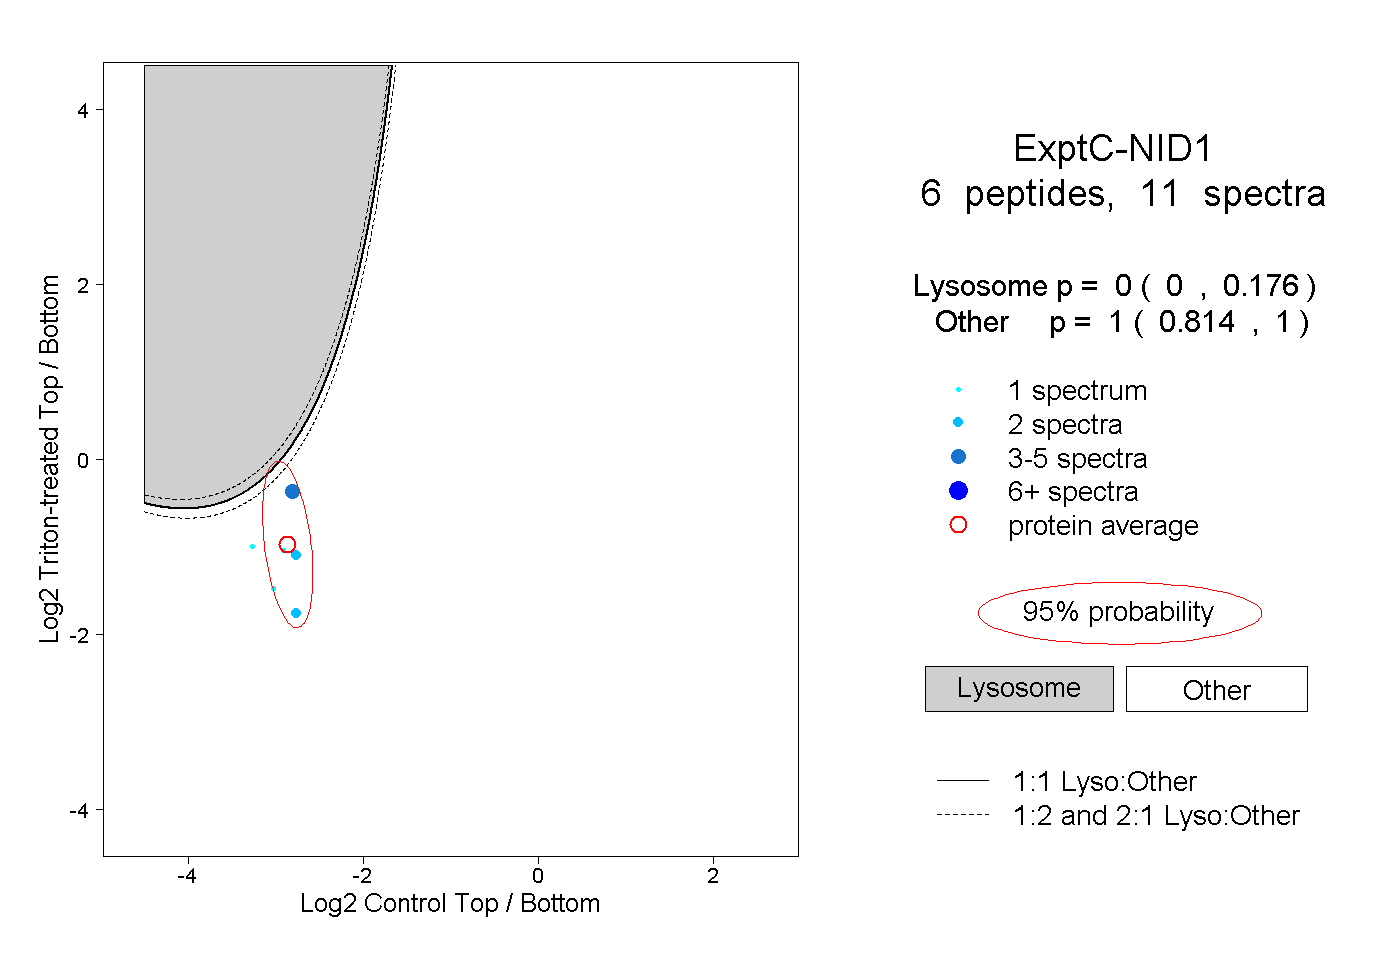
| Plot | Lyso | Other | |||||||||||
| Expt C |
6 peptides |
11 spectra |
|
0.000 0.000 | 0.176 |
1.000 0.814 | 1.000 |
| 1 spectrum, GIVTDSVR | 0.001 | 0.999 | ||||||||
| 2 spectra, SFQLPVER | 0.000 | 1.000 | ||||||||
| 1 spectrum, GLEGFLWK | 0.000 | 1.000 | ||||||||
| 1 spectrum, VLFDTGLVNPR | 0.000 | 1.000 | ||||||||
| 4 spectra, QCVAEGSPQR | 0.009 | 0.991 | ||||||||
| 2 spectra, AECLNPAQPSR | 0.000 | 1.000 |
| Plot | Lyso | Other | |||||||||||
| Expt D |
1 peptide |
2 spectra |
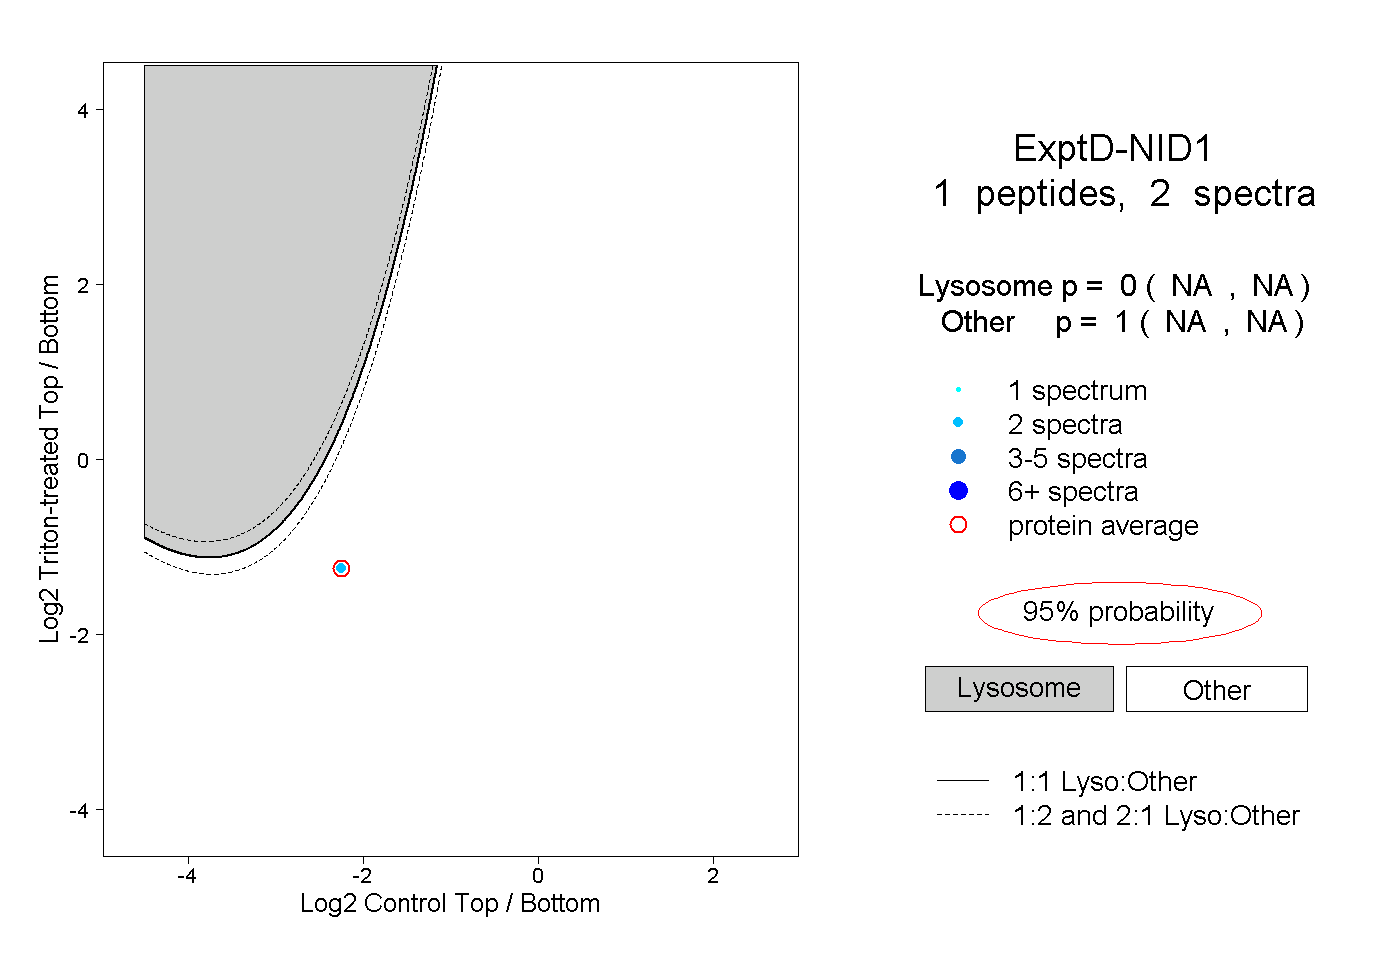 |
0.000 NA | NA |
1.000 NA | NA |