 16
16peptides
spectra
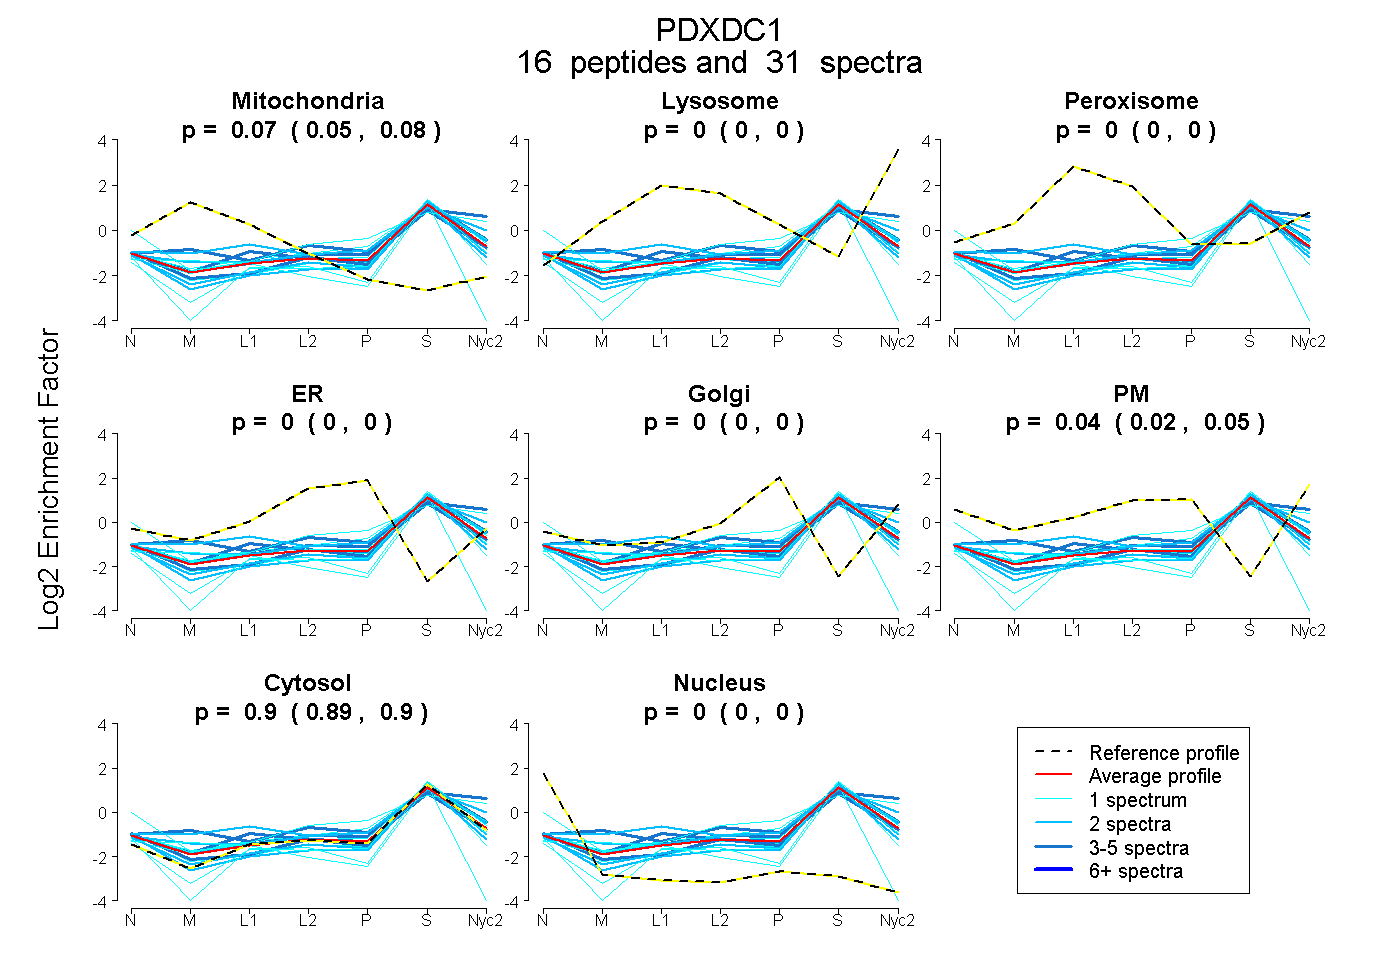
0.053 | 0.077
0.000 | 0.000
0.000 | 0.000
0.000 | 0.000
0.000 | 0.000
0.025 | 0.047
0.890 | 0.903
0.000 | 0.000
5peptides
spectra
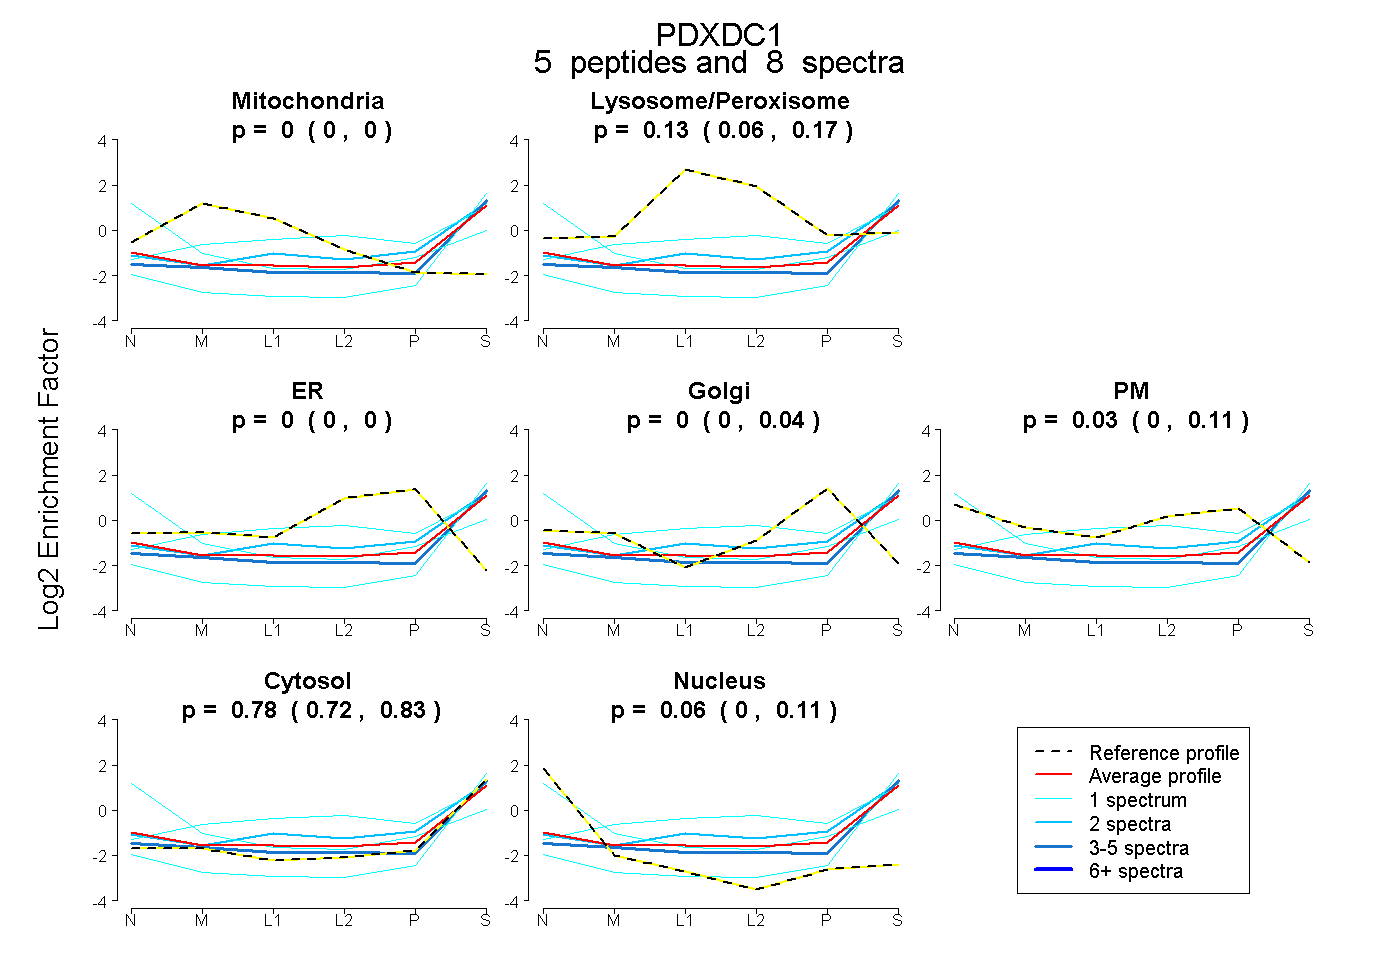
0.000 | 0.000
0.062 | 0.168
0.000 | 0.000
0.000 | 0.037
0.000 | 0.108
0.719 | 0.828
0.000 | 0.106
13peptides
spectra
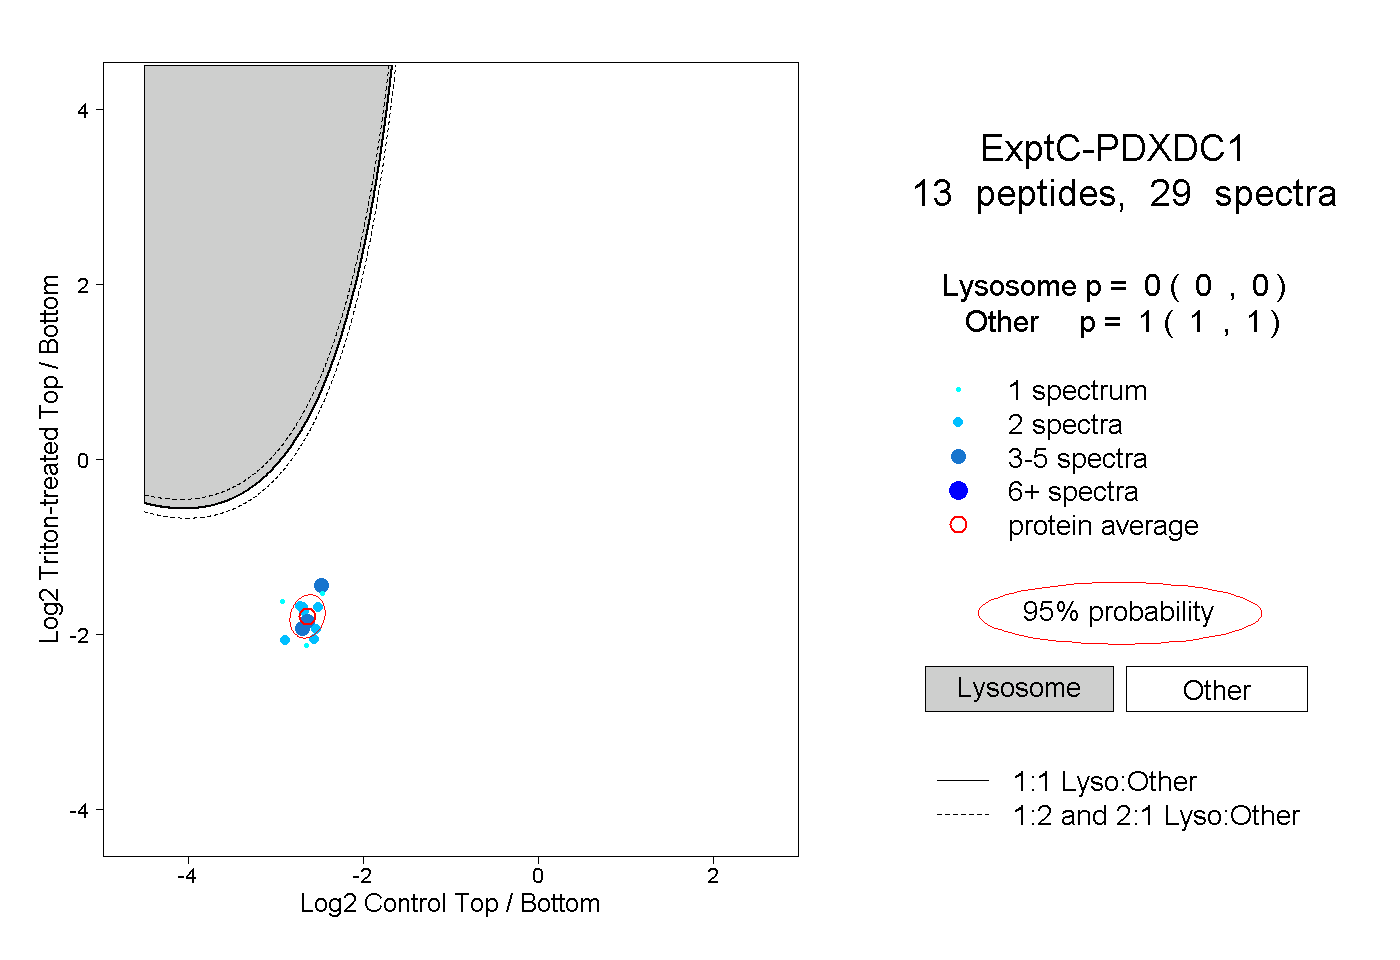
0.000 | 0.000
1.000 | 1.000
1peptide
spectrum
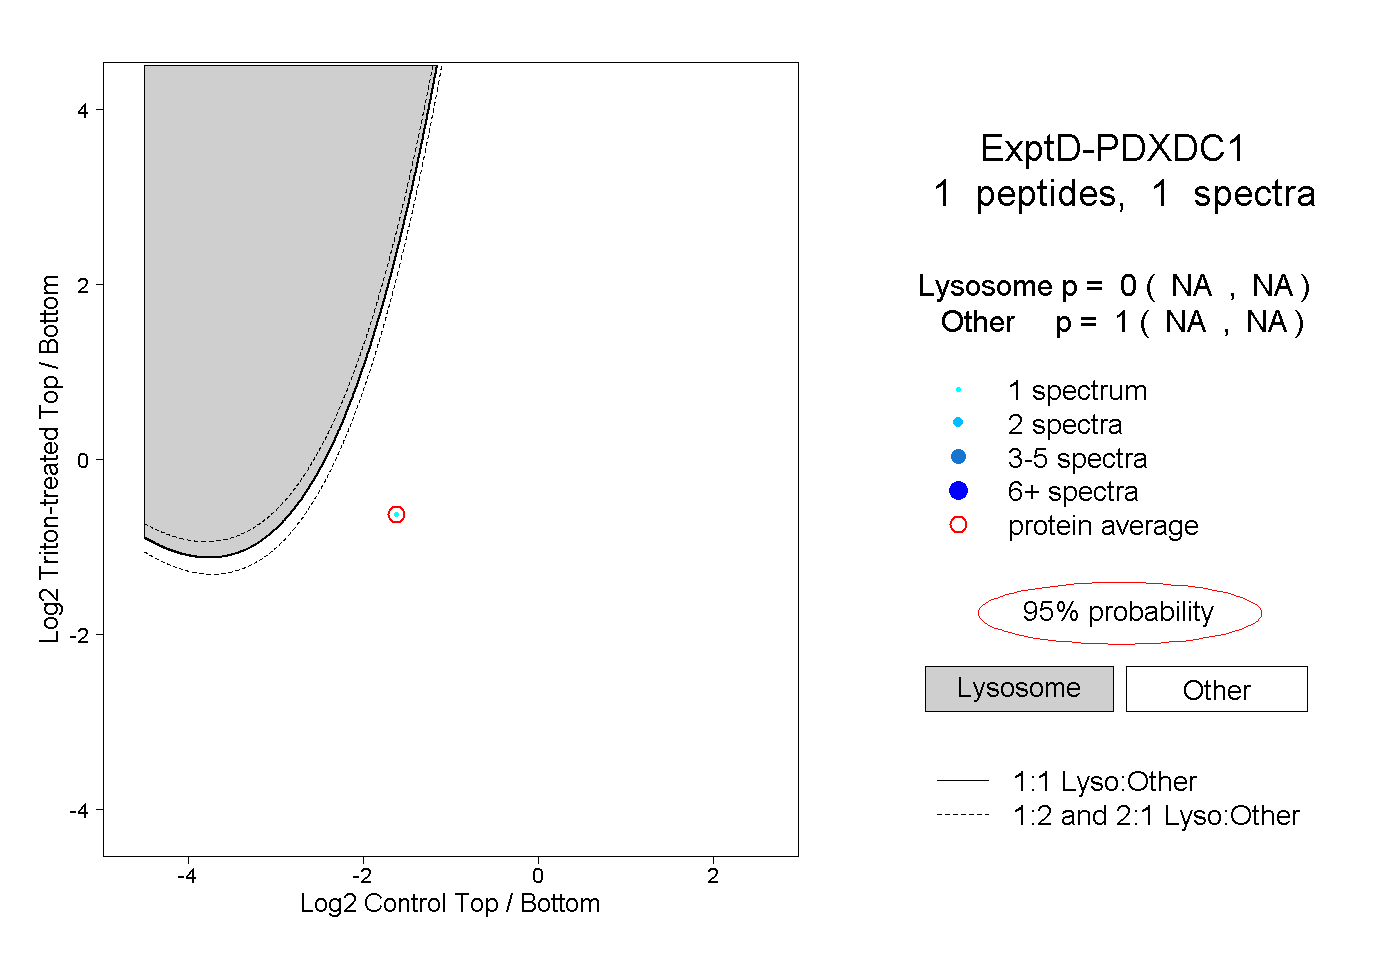
NA | NA
NA | NA