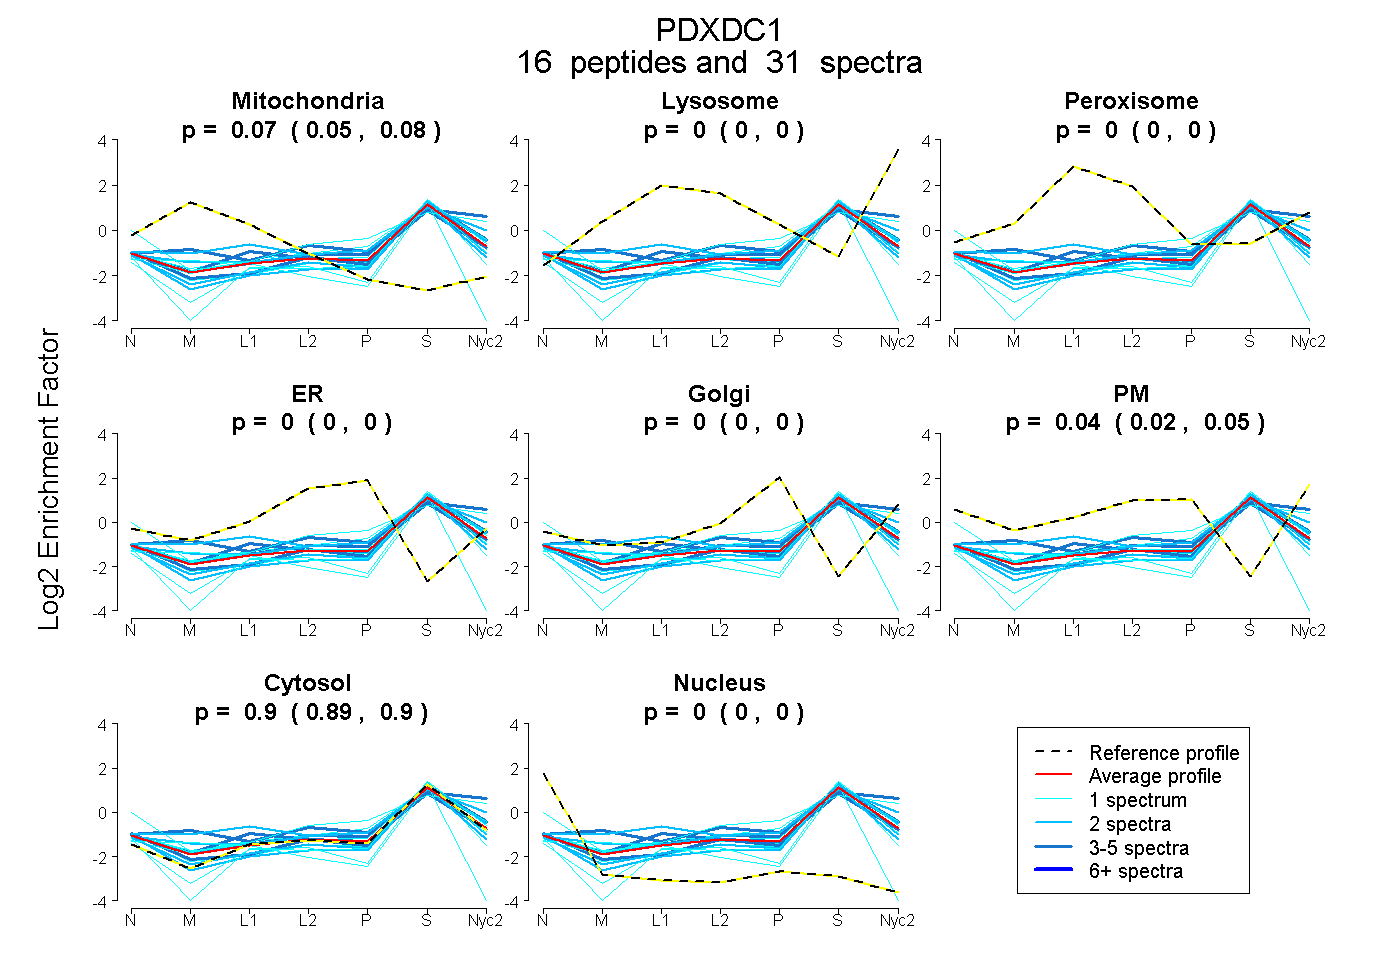
 16
16peptides
spectra
0.053 | 0.077
0.000 | 0.000
0.000 | 0.000
0.000 | 0.000
0.000 | 0.000
0.025 | 0.047
0.890 | 0.903
0.000 | 0.000
| Plot | Mito | Lyso | Perox | ER | Golgi | PM | Cytosol | Nucleus | |||||
| Expt A |
16 peptides |
31 spectra |
|
0.066 0.053 | 0.077 |
0.000 0.000 | 0.000 |
0.000 0.000 | 0.000 |
0.000 0.000 | 0.000 |
0.000 0.000 | 0.000 |
0.037 0.025 | 0.047 |
0.897 0.890 | 0.903 |
0.000 0.000 | 0.000 |
| 1 spectrum, FFQELPTLDPAFK | 0.000 | 0.000 | 0.000 | 0.000 | 0.000 | 0.000 | 0.933 | 0.067 | ||
| 1 spectrum, MLENSPR | 0.000 | 0.000 | 0.000 | 0.000 | 0.000 | 0.319 | 0.681 | 0.000 | ||
| 4 spectra, LLENMTEVVR | 0.000 | 0.000 | 0.000 | 0.000 | 0.000 | 0.047 | 0.931 | 0.022 | ||
| 2 spectra, EIEENSR | 0.000 | 0.000 | 0.000 | 0.000 | 0.000 | 0.000 | 0.913 | 0.087 | ||
| 1 spectrum, VQGTGVTPPPTPSGTR | 0.000 | 0.000 | 0.000 | 0.000 | 0.000 | 0.000 | 0.967 | 0.033 | ||
| 2 spectra, VAAVSNIAAAAVGR | 0.000 | 0.002 | 0.000 | 0.000 | 0.000 | 0.000 | 0.971 | 0.028 | ||
| 1 spectrum, VEQLPSGLEHDNLEAQCPEQPCR | 0.136 | 0.000 | 0.000 | 0.000 | 0.000 | 0.000 | 0.652 | 0.212 | ||
| 2 spectra, YENGCAYFHEK | 0.095 | 0.187 | 0.006 | 0.000 | 0.000 | 0.000 | 0.712 | 0.000 | ||
| 1 spectrum, GIQEAQVQLQK | 0.000 | 0.023 | 0.031 | 0.000 | 0.093 | 0.024 | 0.829 | 0.000 | ||
| 1 spectrum, LPLLLVANAGTAAVGHTDK | 0.015 | 0.050 | 0.000 | 0.000 | 0.005 | 0.016 | 0.914 | 0.000 | ||
| 3 spectra, IHTGLLK | 0.026 | 0.212 | 0.000 | 0.000 | 0.000 | 0.060 | 0.702 | 0.000 | ||
| 1 spectrum, LAIHSR | 0.107 | 0.000 | 0.000 | 0.000 | 0.000 | 0.000 | 0.893 | 0.000 | ||
| 1 spectrum, LNELESDLTFK | 0.000 | 0.000 | 0.000 | 0.000 | 0.000 | 0.000 | 0.913 | 0.087 | ||
| 5 spectra, FSPLMTAEALGTR | 0.015 | 0.016 | 0.000 | 0.000 | 0.000 | 0.091 | 0.879 | 0.000 | ||
| 3 spectra, IADPTLAEMGK | 0.099 | 0.000 | 0.054 | 0.000 | 0.000 | 0.016 | 0.832 | 0.000 | ||
| 2 spectra, MGPEYK | 0.116 | 0.000 | 0.000 | 0.055 | 0.000 | 0.000 | 0.829 | 0.000 |
| Plot | Mito | Lyso or Perox | ER | Golgi | PM | Cytosol | Nucleus | ||||||
| Expt B |
5 peptides |
8 spectra |
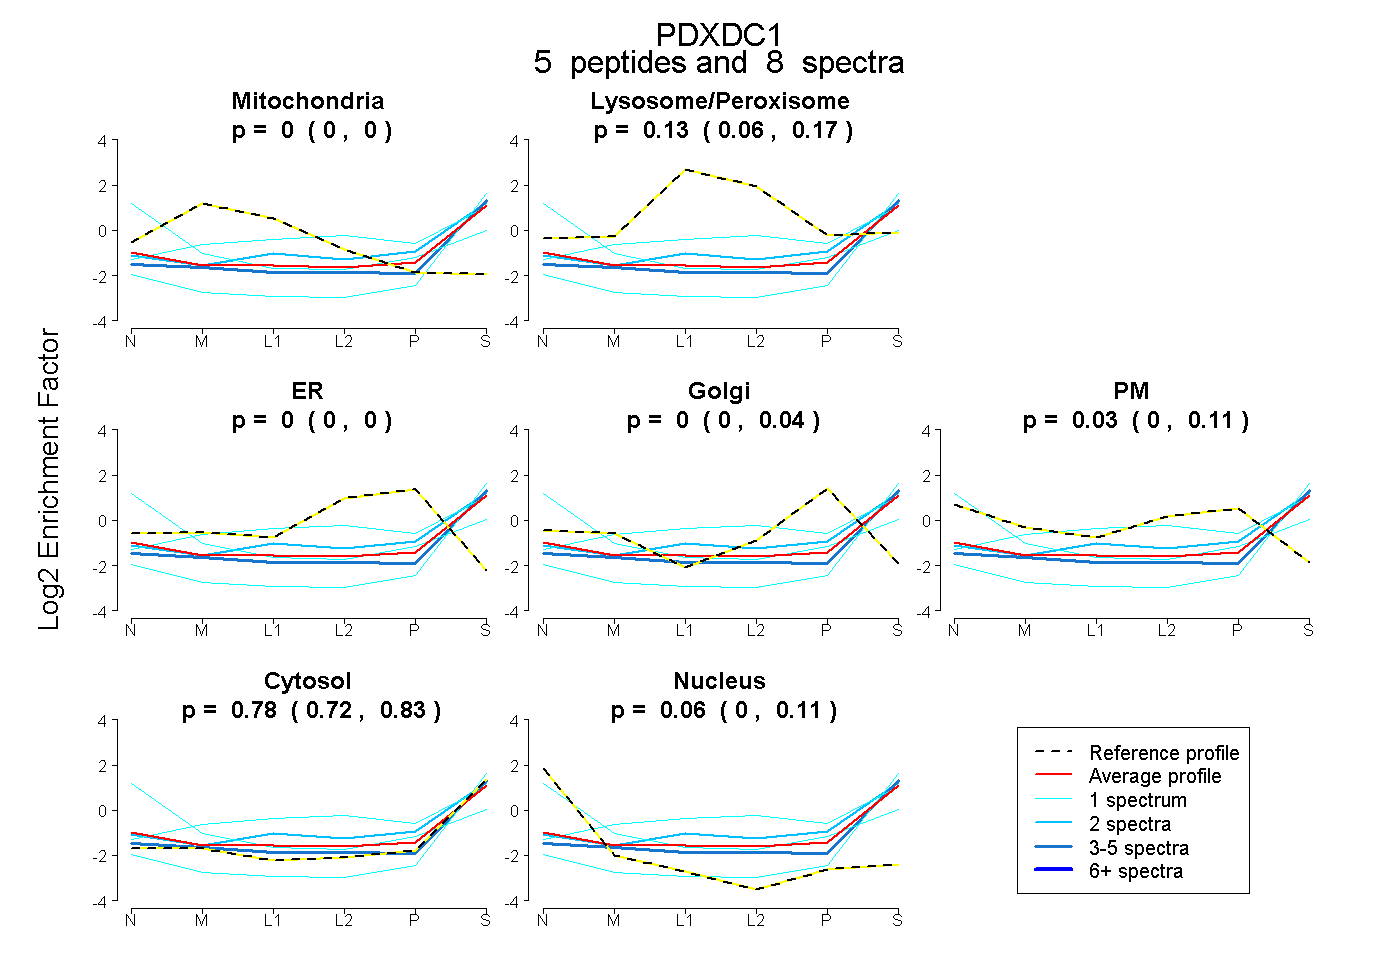 |
0.000 0.000 | 0.000 |
0.128 0.062 | 0.168 |
0.000 0.000 | 0.000 |
0.000 0.000 | 0.037 |
0.030 0.000 | 0.108 |
0.781 0.719 | 0.828 |
0.061 0.000 | 0.106 |
|||
| Plot | Lyso | Other | |||||||||||
| Expt C |
13 peptides |
29 spectra |
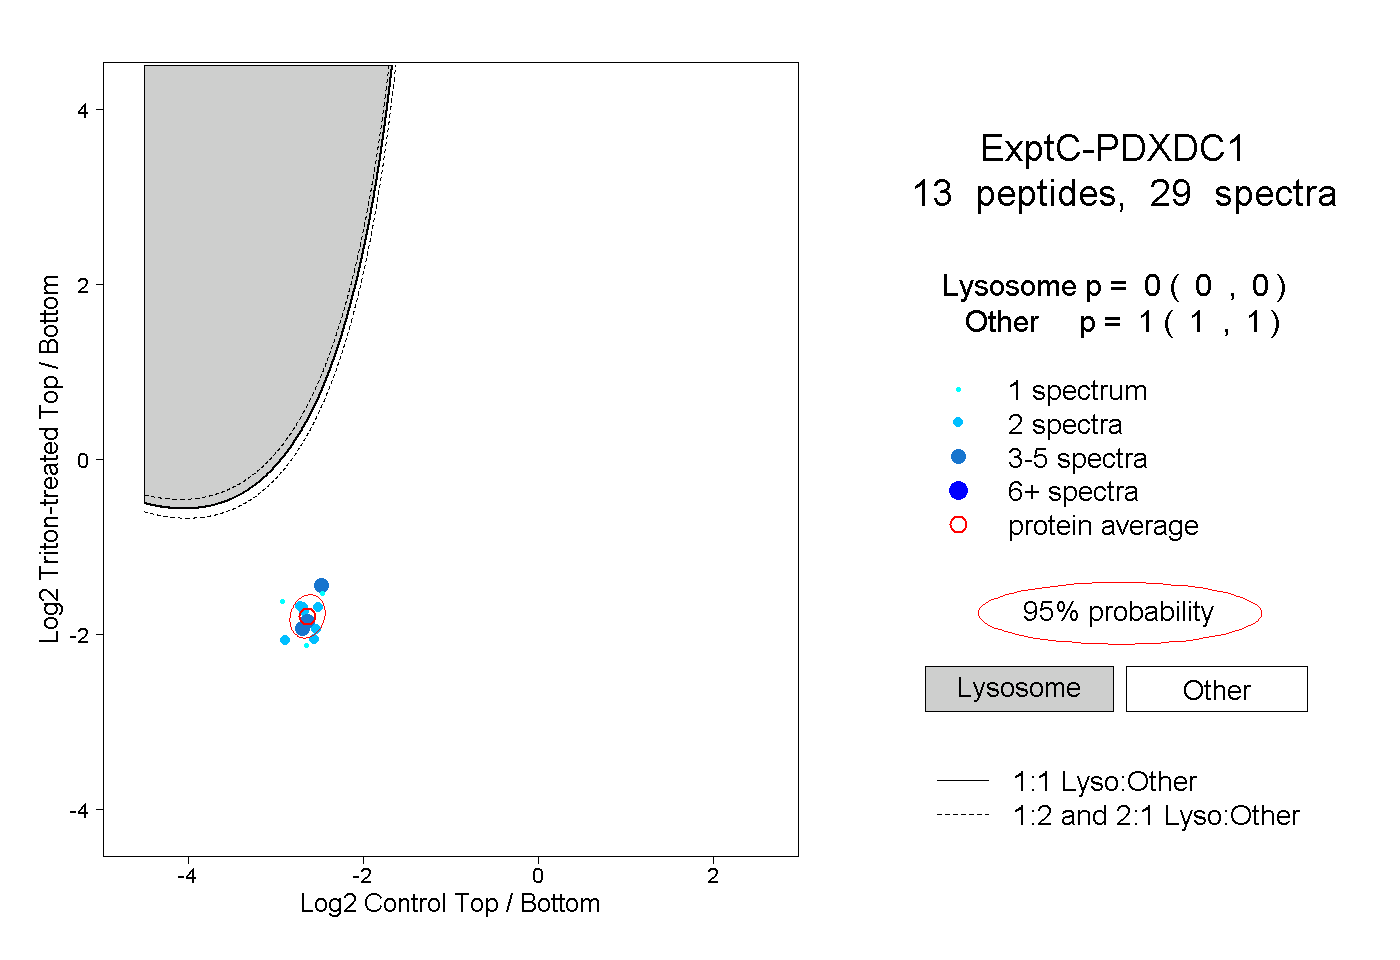 |
0.000 0.000 | 0.000 |
1.000 1.000 | 1.000 |
||||||||
| Plot | Lyso | Other | |||||||||||
| Expt D |
1 peptide |
1 spectrum |
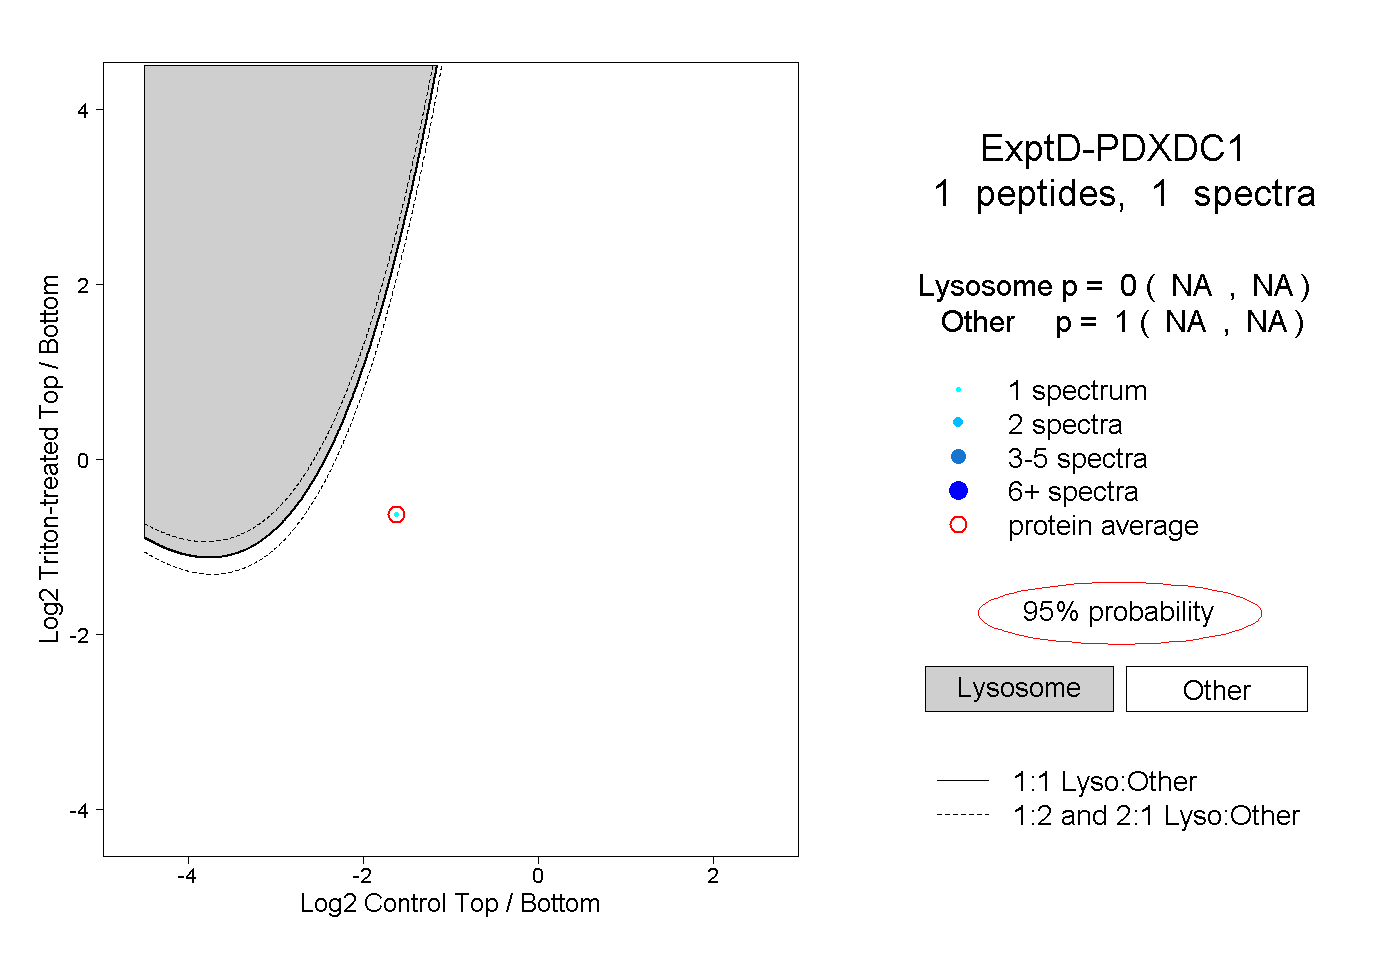 |
0.000 NA | NA |
1.000 NA | NA |