 3
3peptides
spectra
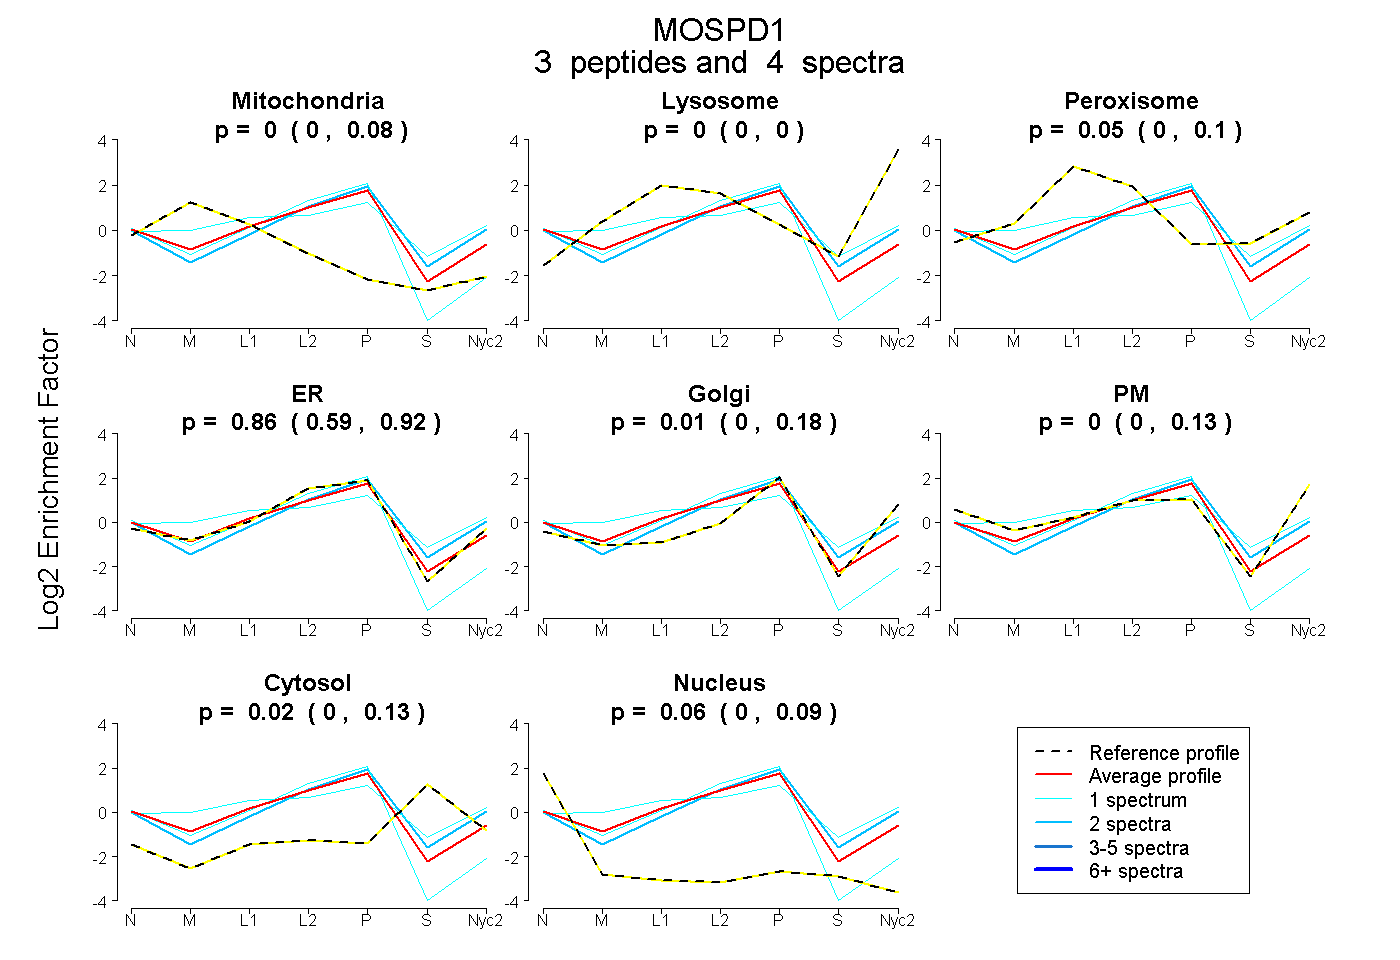
0.000 | 0.080
0.000 | 0.000
0.000 | 0.101
0.590 | 0.918
0.000 | 0.183
0.000 | 0.129
0.000 | 0.133
0.000 | 0.087
1peptide
spectrum
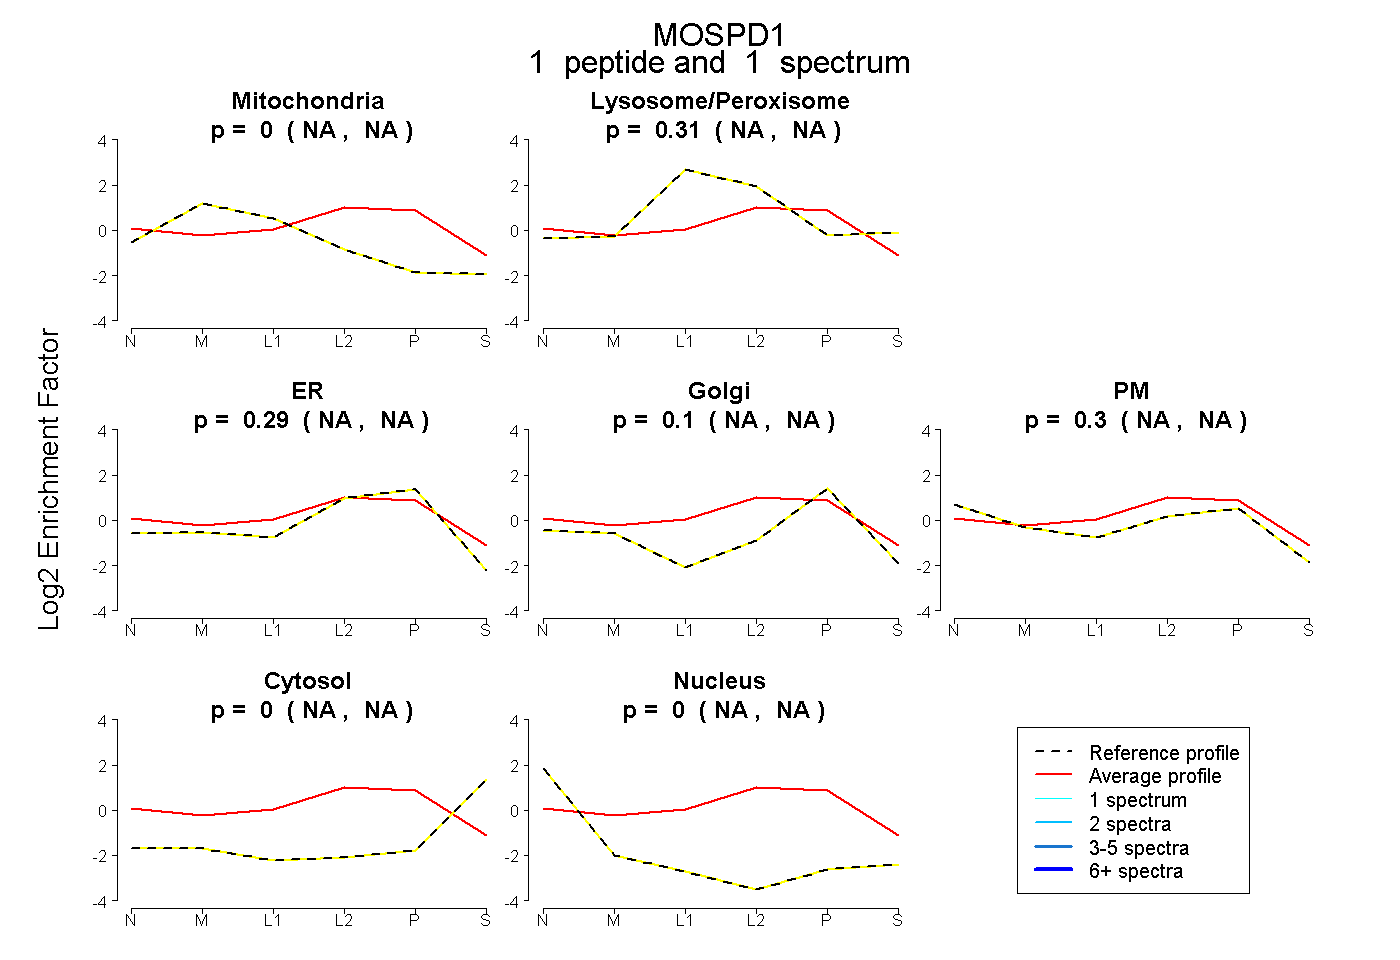
NA | NA
NA | NA
NA | NA
NA | NA
NA | NA
NA | NA
NA | NA
2peptides
spectra
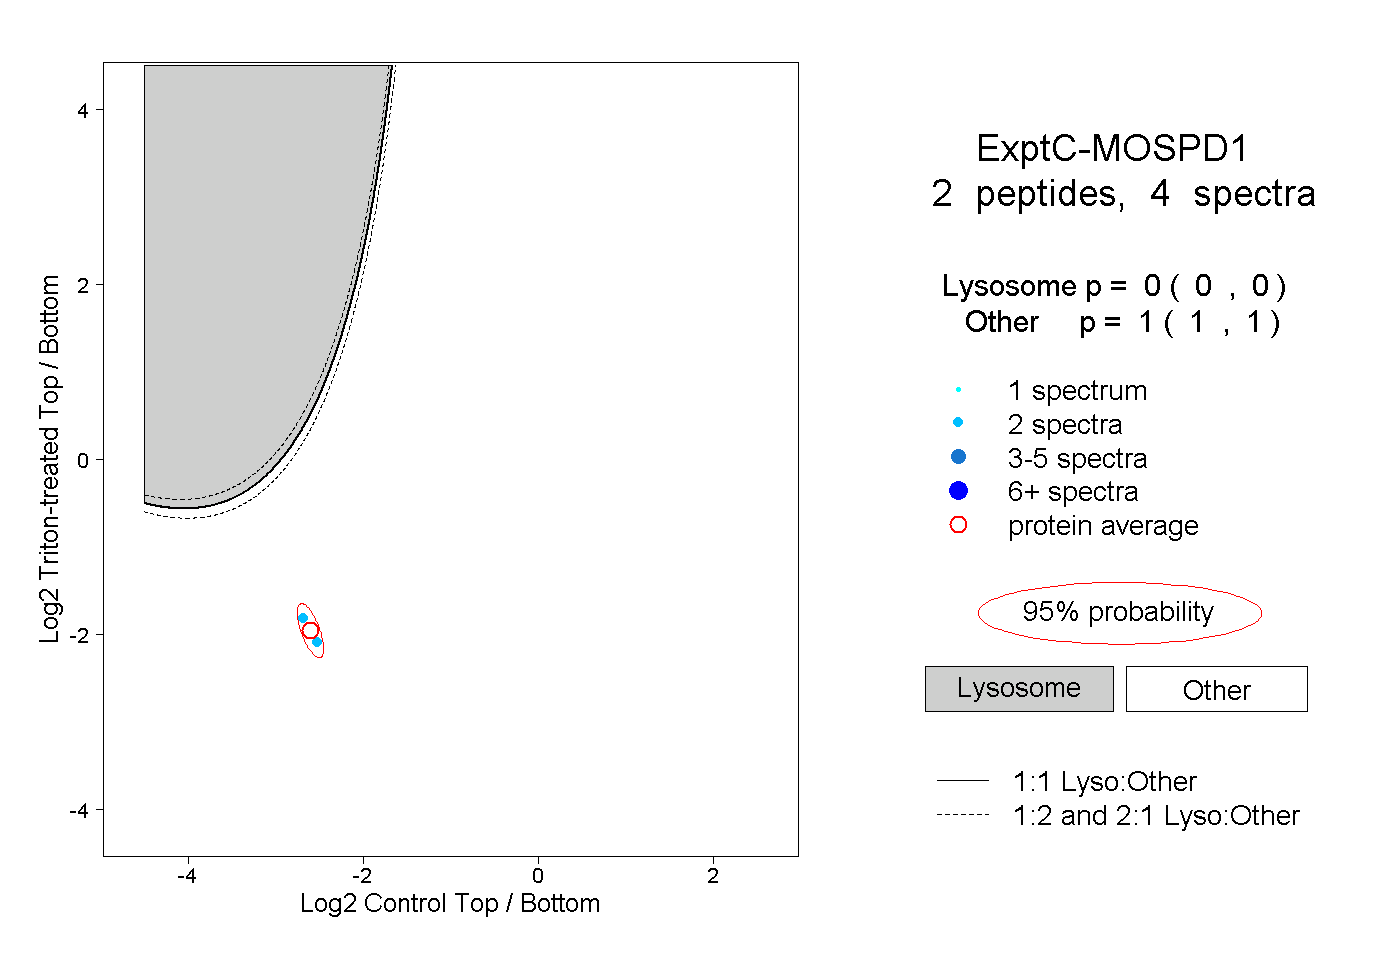
0.000 | 0.000
1.000 | 1.000