 3
3peptides
spectra
0.000 | 0.080
0.000 | 0.000
0.000 | 0.101
0.590 | 0.918
0.000 | 0.183
0.000 | 0.129
0.000 | 0.133
0.000 | 0.087
| Plot | Mito | Lyso | Perox | ER | Golgi | PM | Cytosol | Nucleus | |||||
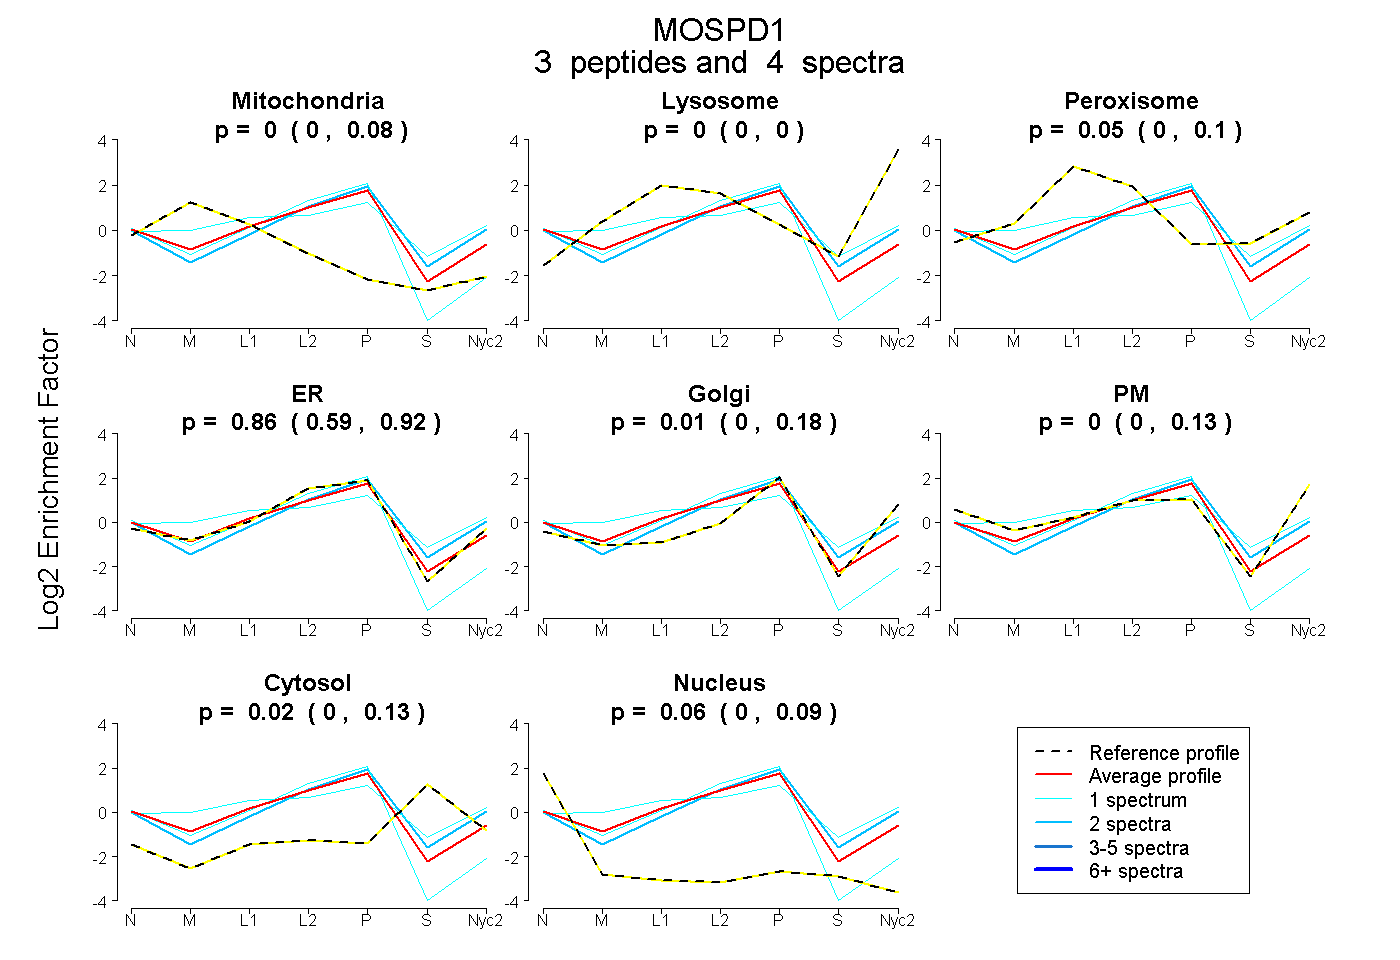
| Expt A |
3 peptides |
4 spectra |
|
0.000 0.000 | 0.080 |
0.000 0.000 | 0.000 |
0.048 0.000 | 0.101 |
0.860 0.590 | 0.918 |
0.012 0.000 | 0.183 |
0.000 0.000 | 0.129 |
0.024 0.000 | 0.133 |
0.057 0.000 | 0.087 |
| 1 spectrum, QVLTLYNPYEFALK | 0.045 | 0.000 | 0.358 | 0.133 | 0.434 | 0.000 | 0.030 | 0.000 | ||
| 1 spectrum, VLCTTPNK | 0.000 | 0.000 | 0.000 | 0.891 | 0.000 | 0.000 | 0.000 | 0.109 | ||
| 2 spectra, LQVSEQSQR | 0.000 | 0.000 | 0.000 | 0.658 | 0.156 | 0.058 | 0.129 | 0.000 |
| Plot | Mito | Lyso or Perox | ER | Golgi | PM | Cytosol | Nucleus | ||||||
| Expt B |
1 peptide |
1 spectrum |
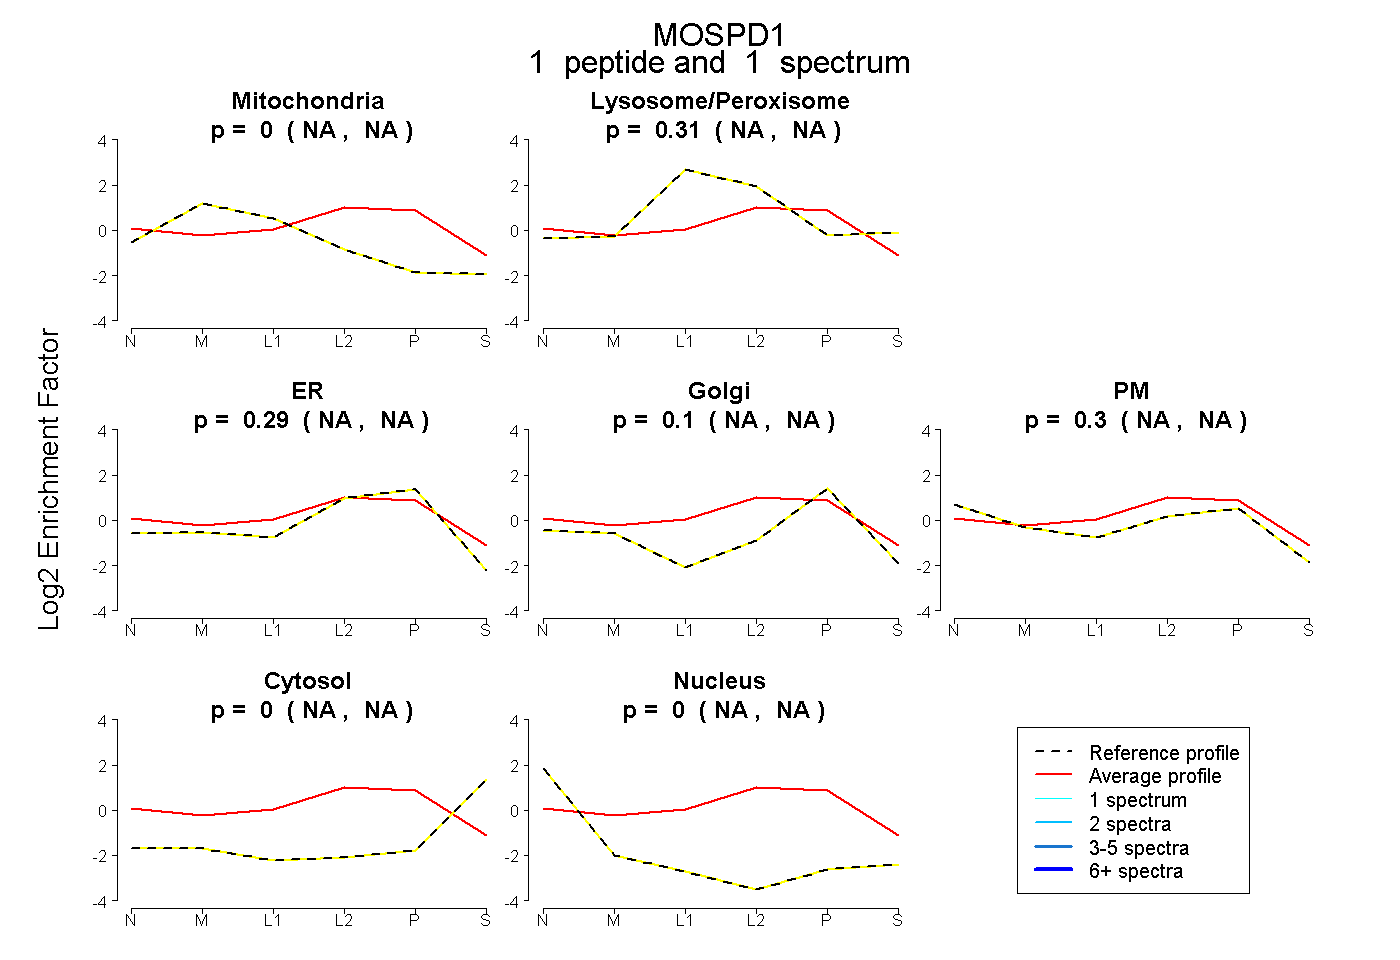 |
0.000 NA | NA |
0.313 NA | NA |
0.286 NA | NA |
0.097 NA | NA |
0.304 NA | NA |
0.000 NA | NA |
0.000 NA | NA |
|||
| Plot | Lyso | Other | |||||||||||
| Expt C |
2 peptides |
4 spectra |
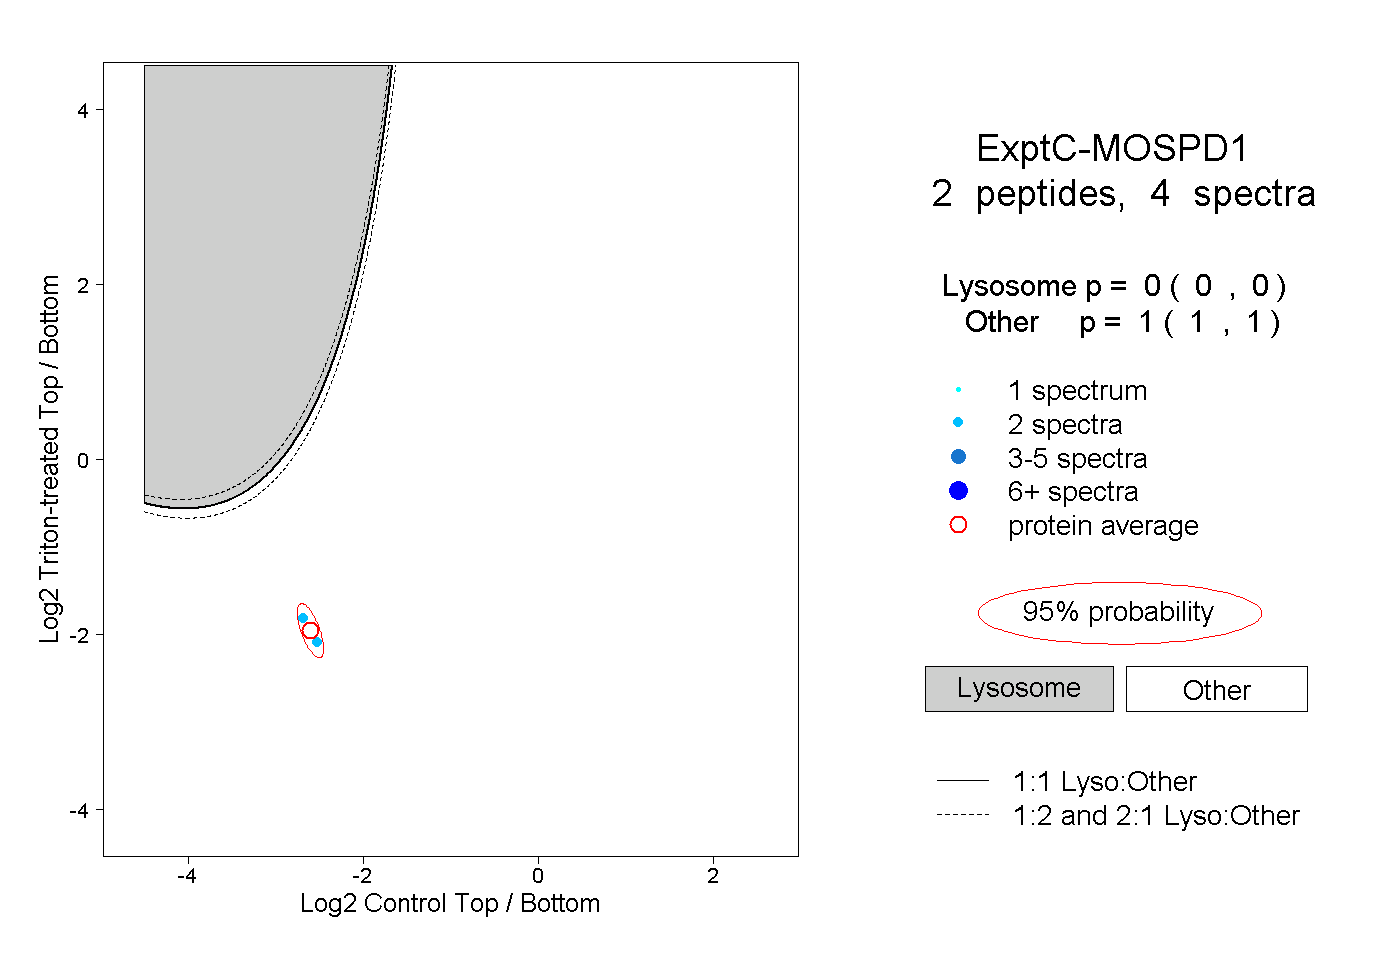 |
0.000 0.000 | 0.000 |
1.000 1.000 | 1.000 |