 9
9peptides
spectra

0.000 | 0.000
0.000 | 0.009
0.000 | 0.000
0.000 | 0.000
0.000 | 0.000
0.638 | 0.657
0.341 | 0.354
0.000 | 0.000
2peptides
spectra
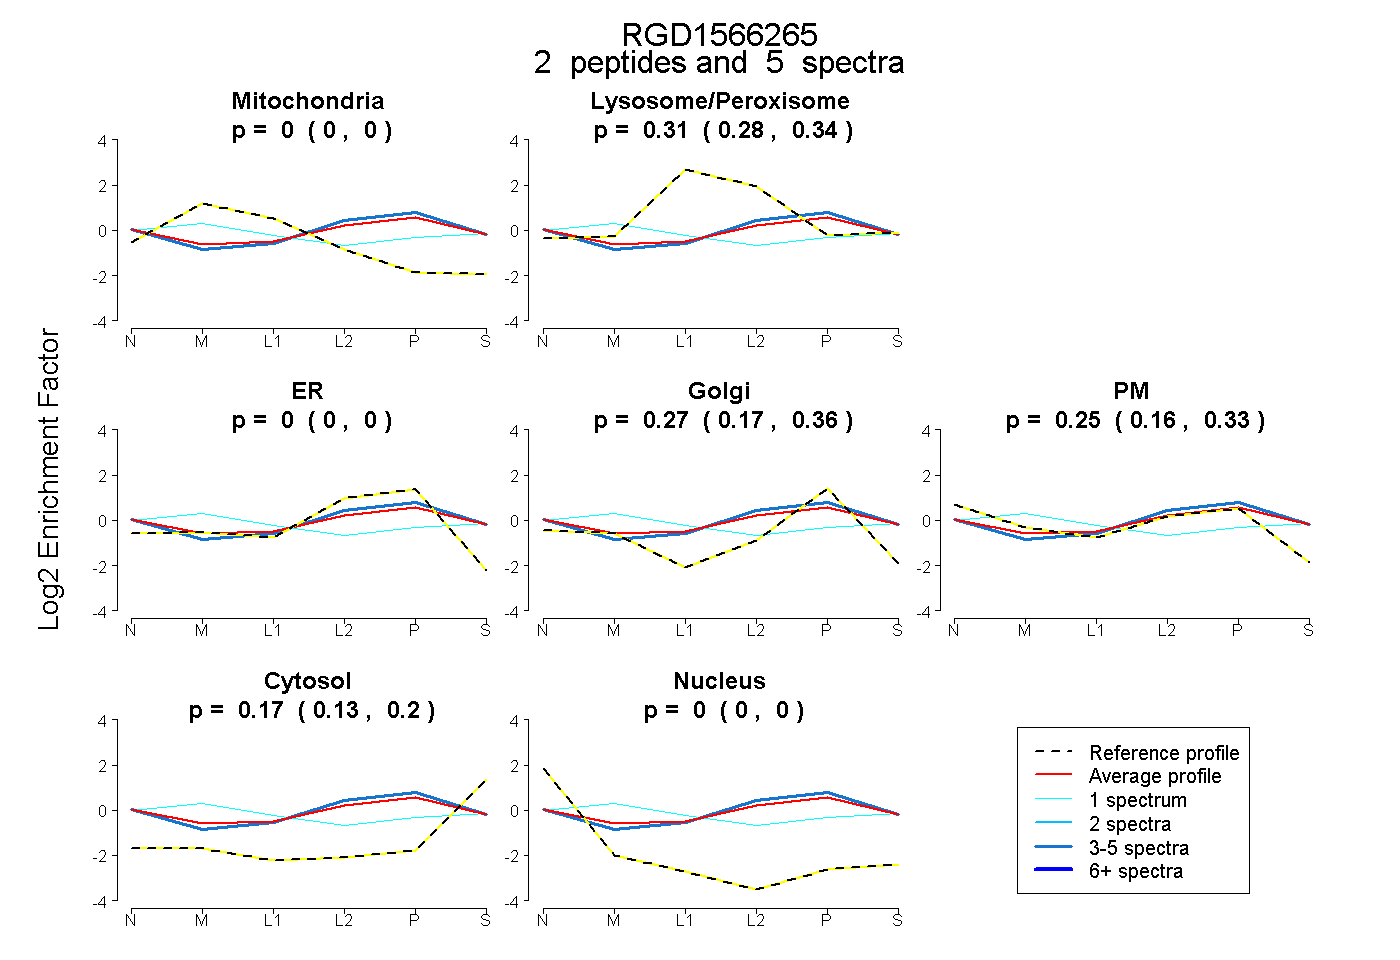
0.000 | 0.000
0.279 | 0.336
0.000 | 0.000
0.172 | 0.355
0.158 | 0.326
0.131 | 0.200
0.000 | 0.000
8peptides
spectra
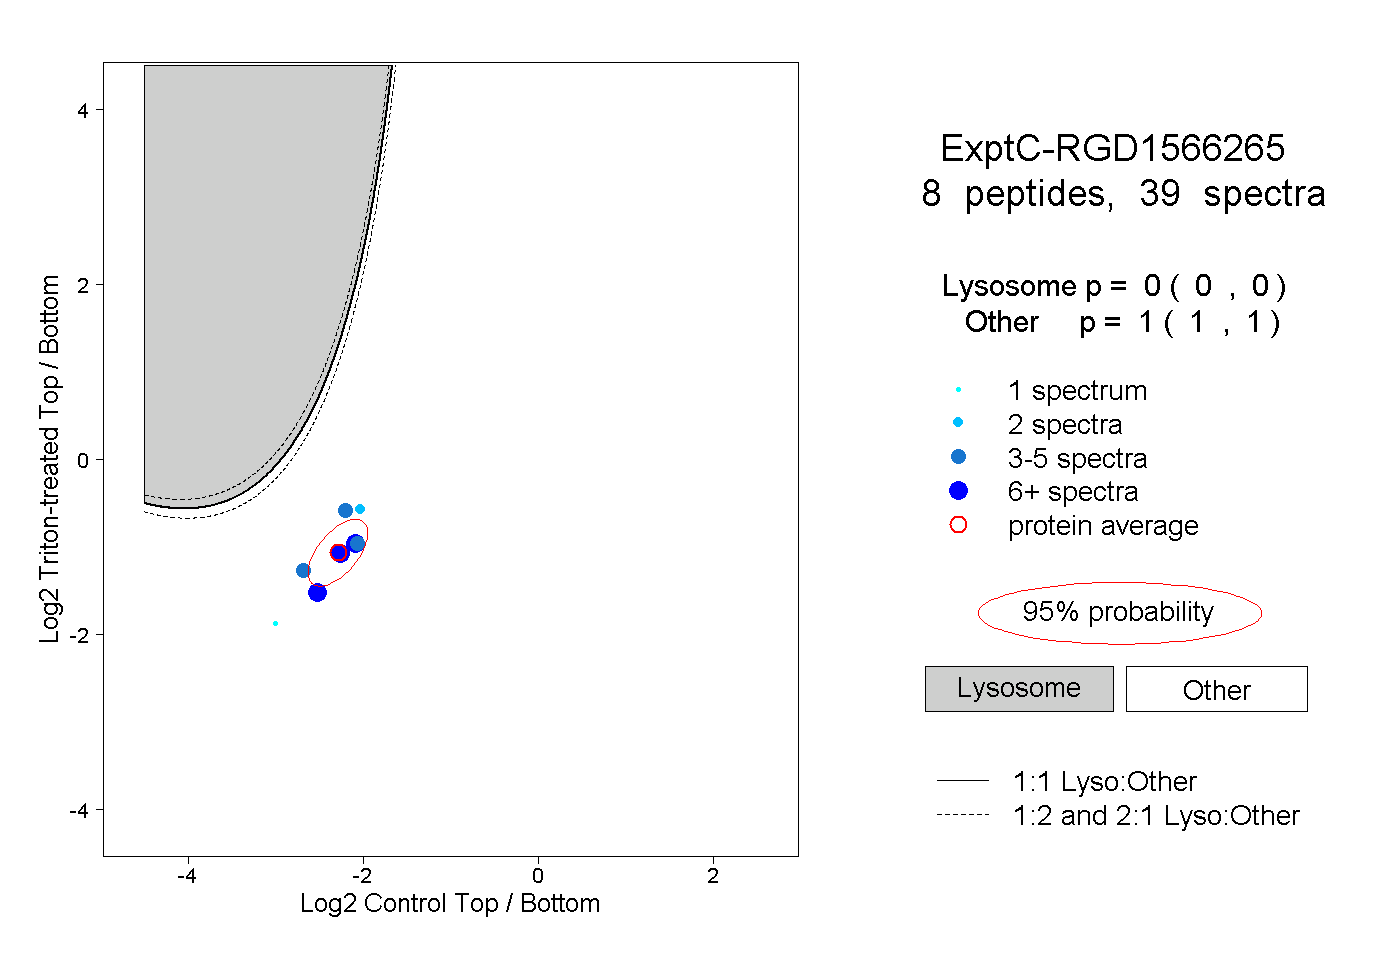
0.000 | 0.000
1.000 | 1.000
2peptides
spectra

NA | NA
NA | NA