 9
9peptides
spectra

0.000 | 0.000
0.000 | 0.009
0.000 | 0.000
0.000 | 0.000
0.000 | 0.000
0.638 | 0.657
0.341 | 0.354
0.000 | 0.000
| Plot | Mito | Lyso | Perox | ER | Golgi | PM | Cytosol | Nucleus | |||||
| Expt A |
9 peptides |
29 spectra |
|
0.000 0.000 | 0.000 |
0.000 0.000 | 0.009 |
0.000 0.000 | 0.000 |
0.000 0.000 | 0.000 |
0.000 0.000 | 0.000 |
0.652 0.638 | 0.657 |
0.348 0.341 | 0.354 |
0.000 0.000 | 0.000 |
| 2 spectra, SMDATLR | 0.000 | 0.000 | 0.000 | 0.000 | 0.000 | 0.552 | 0.448 | 0.000 | ||
| 2 spectra, SMAGVVK | 0.000 | 0.040 | 0.000 | 0.000 | 0.000 | 0.596 | 0.364 | 0.000 | ||
| 3 spectra, IHAENAIR | 0.000 | 0.000 | 0.053 | 0.000 | 0.000 | 0.744 | 0.203 | 0.000 | ||
| 4 spectra, VDAVAAR | 0.000 | 0.154 | 0.013 | 0.000 | 0.000 | 0.351 | 0.482 | 0.000 | ||
| 3 spectra, NQAINFLR | 0.000 | 0.019 | 0.000 | 0.000 | 0.000 | 0.721 | 0.259 | 0.000 | ||
| 9 spectra, HLFNLK | 0.000 | 0.000 | 0.000 | 0.000 | 0.000 | 0.699 | 0.301 | 0.000 | ||
| 1 spectrum, ISALMDK | 0.000 | 0.111 | 0.000 | 0.000 | 0.000 | 0.482 | 0.407 | 0.000 | ||
| 3 spectra, VQTAVTMGK | 0.000 | 0.000 | 0.005 | 0.000 | 0.000 | 0.724 | 0.271 | 0.000 | ||
| 2 spectra, GNTEVAR | 0.000 | 0.000 | 0.000 | 0.000 | 0.000 | 0.604 | 0.396 | 0.000 |
| Plot | Mito | Lyso or Perox | ER | Golgi | PM | Cytosol | Nucleus | ||||||
| Expt B |
2 peptides |
5 spectra |
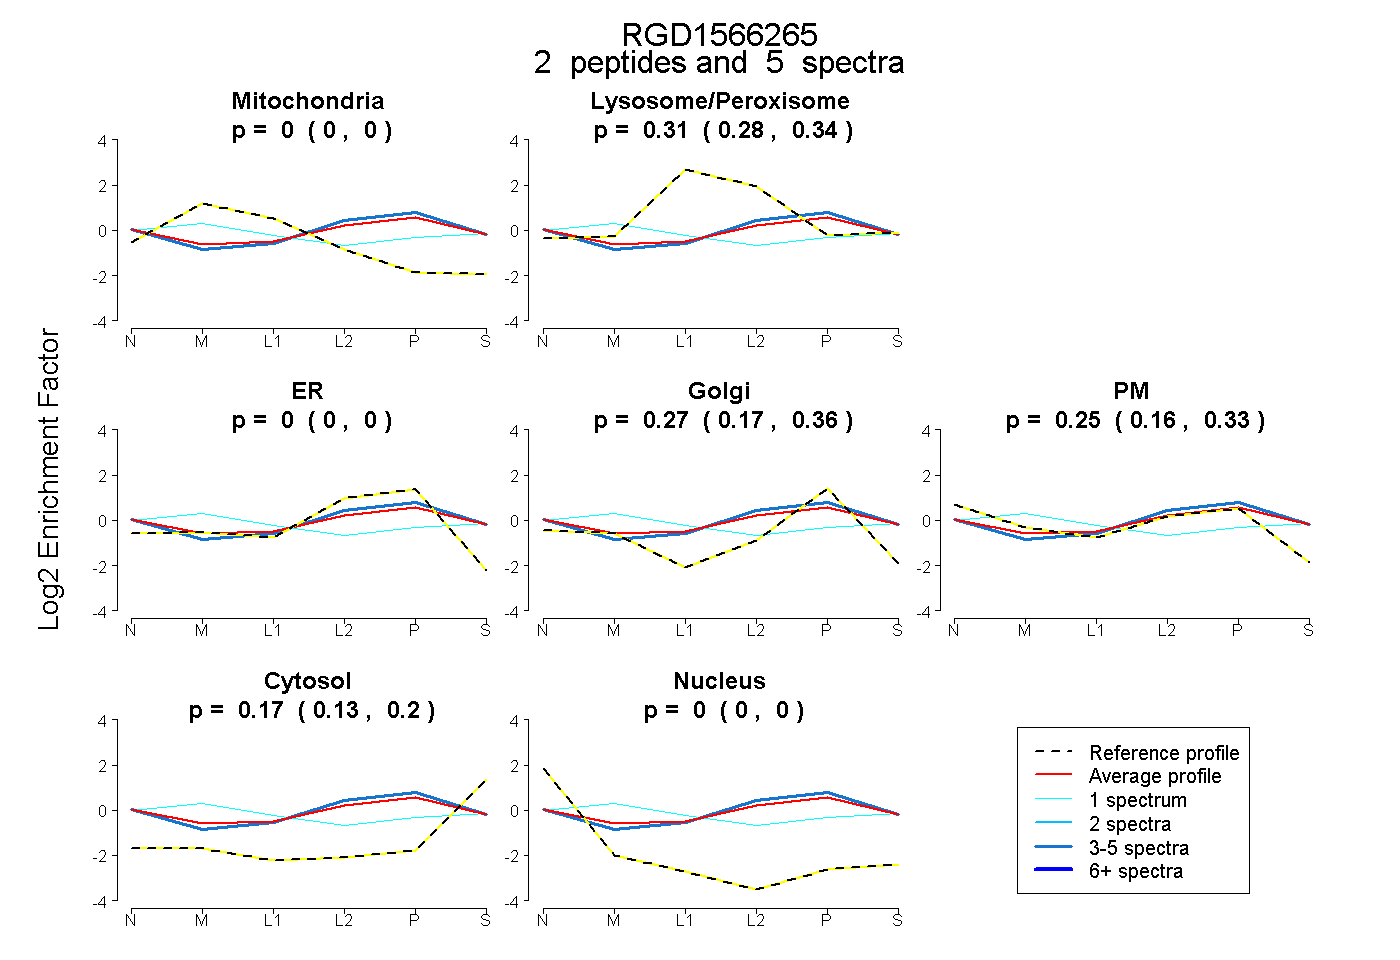 |
0.000 0.000 | 0.000 |
0.311 0.279 | 0.336 |
0.000 0.000 | 0.000 |
0.272 0.172 | 0.355 |
0.248 0.158 | 0.326 |
0.169 0.131 | 0.200 |
0.000 0.000 | 0.000 |
|||
| Plot | Lyso | Other | |||||||||||
| Expt C |
8 peptides |
39 spectra |
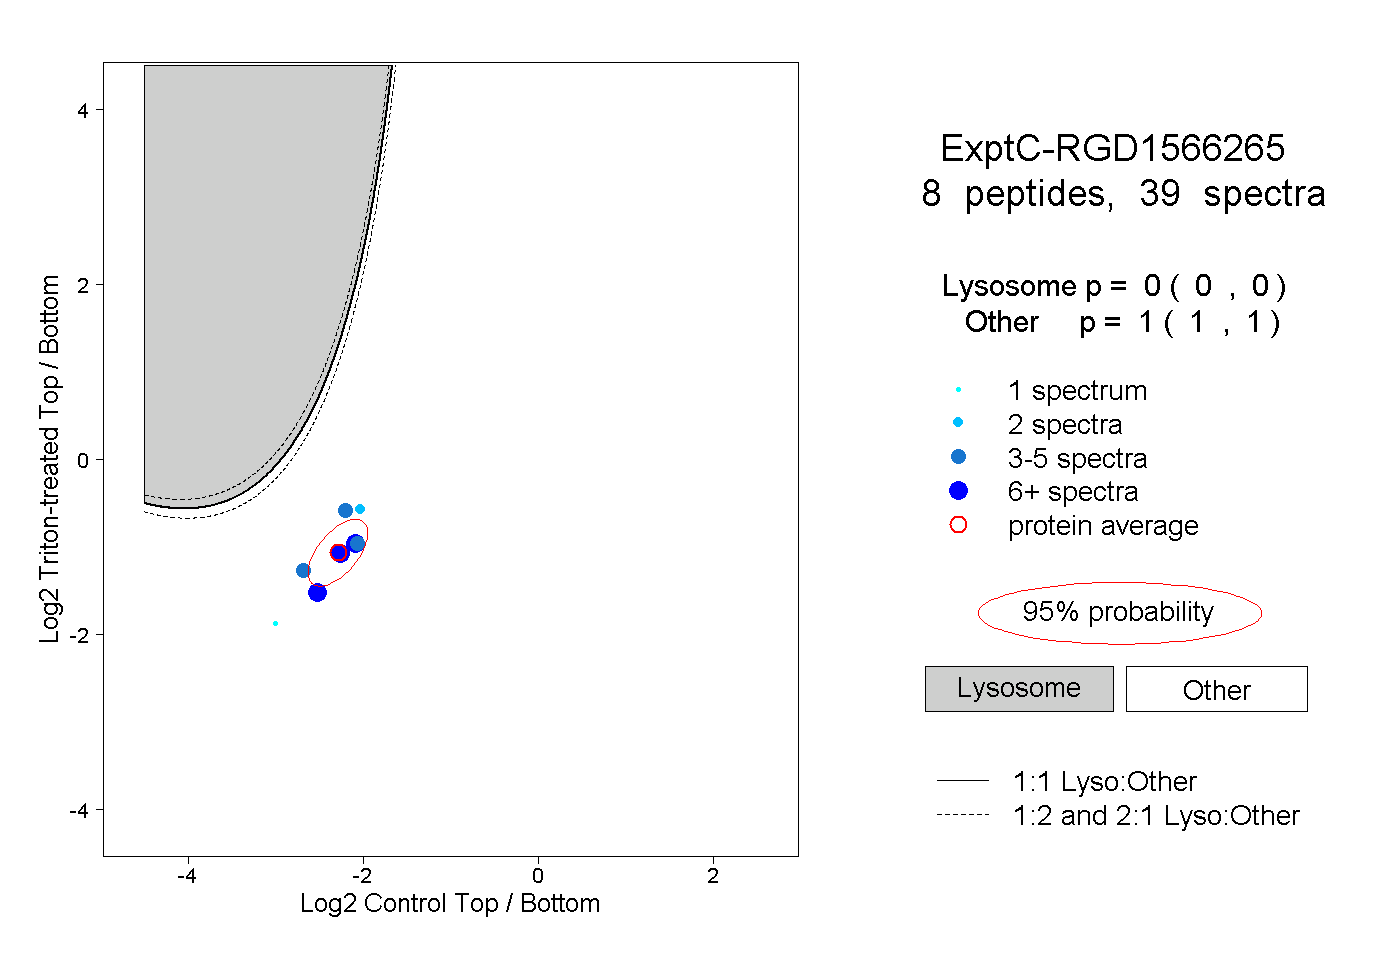 |
0.000 0.000 | 0.000 |
1.000 1.000 | 1.000 |
||||||||
| Plot | Lyso | Other | |||||||||||
| Expt D |
2 peptides |
2 spectra |
 |
0.000 NA | NA |
1.000 NA | NA |