 4
4peptides
spectra
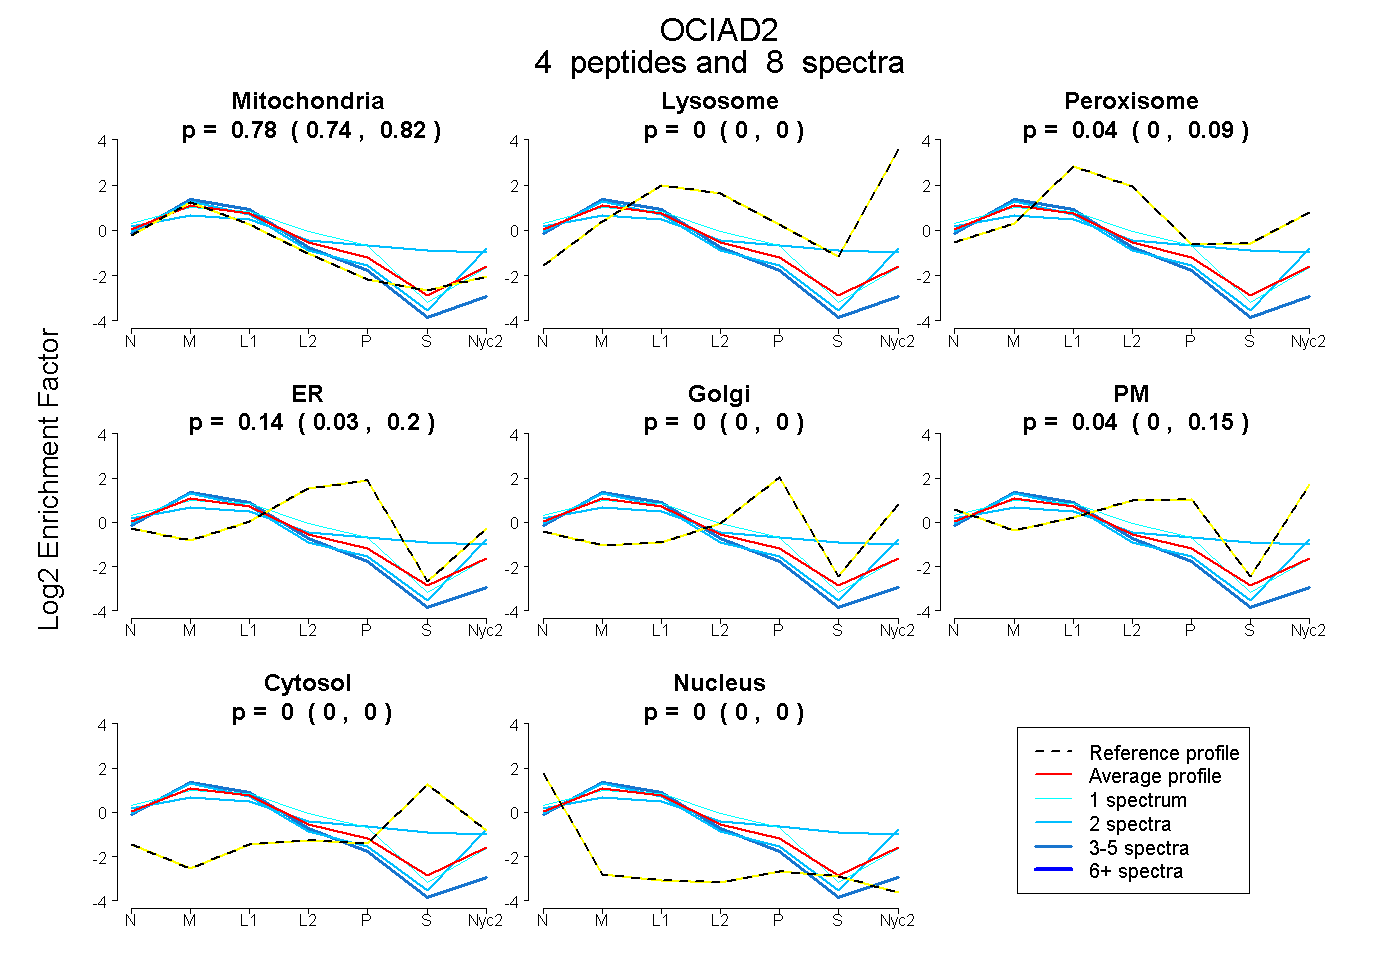
0.736 | 0.818
0.000 | 0.000
0.000 | 0.091
0.032 | 0.199
0.000 | 0.000
0.000 | 0.151
0.000 | 0.000
0.000 | 0.000
1peptide
spectra
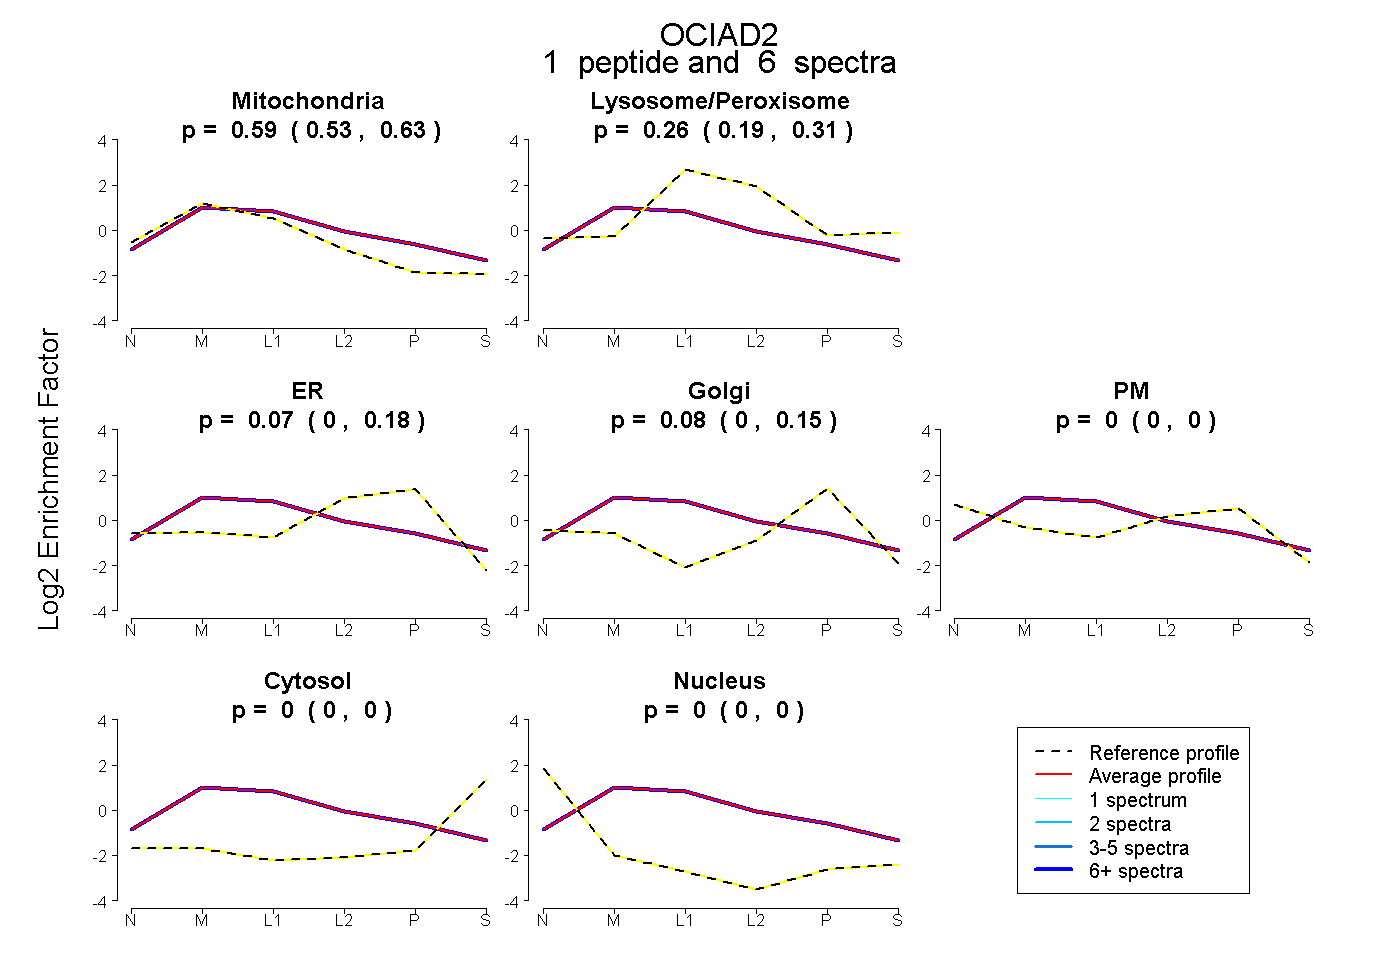
0.534 | 0.633
0.187 | 0.306
0.000 | 0.182
0.000 | 0.149
0.000 | 0.000
0.000 | 0.000
0.000 | 0.000
4peptides
spectra
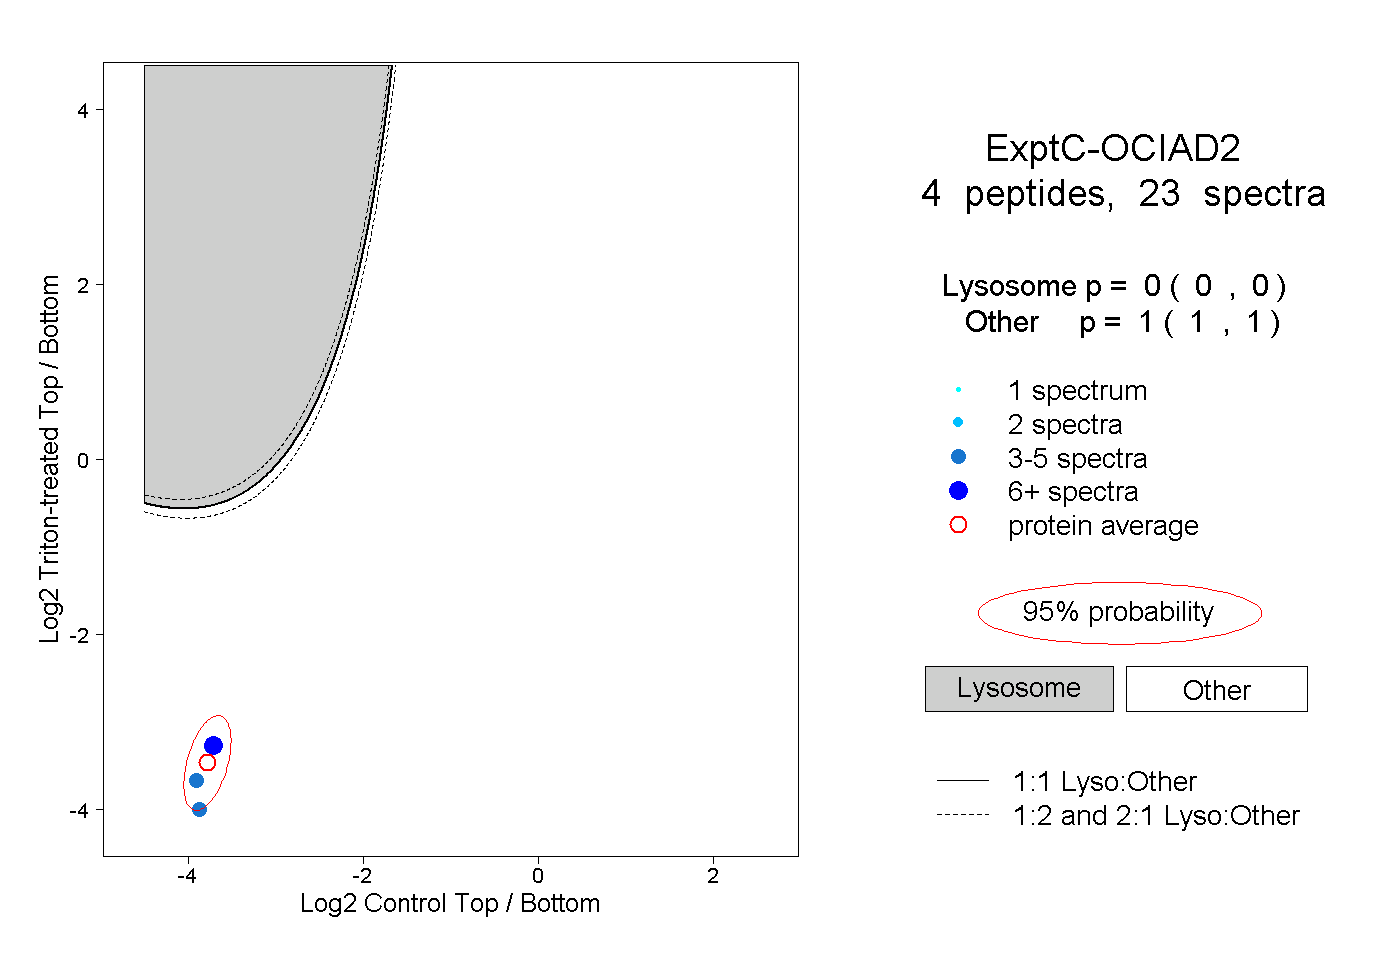
0.000 | 0.000
1.000 | 1.000