 4
4peptides
spectra
0.736 | 0.818
0.000 | 0.000
0.000 | 0.091
0.032 | 0.199
0.000 | 0.000
0.000 | 0.151
0.000 | 0.000
0.000 | 0.000
| Plot | Mito | Lyso | Perox | ER | Golgi | PM | Cytosol | Nucleus | |||||
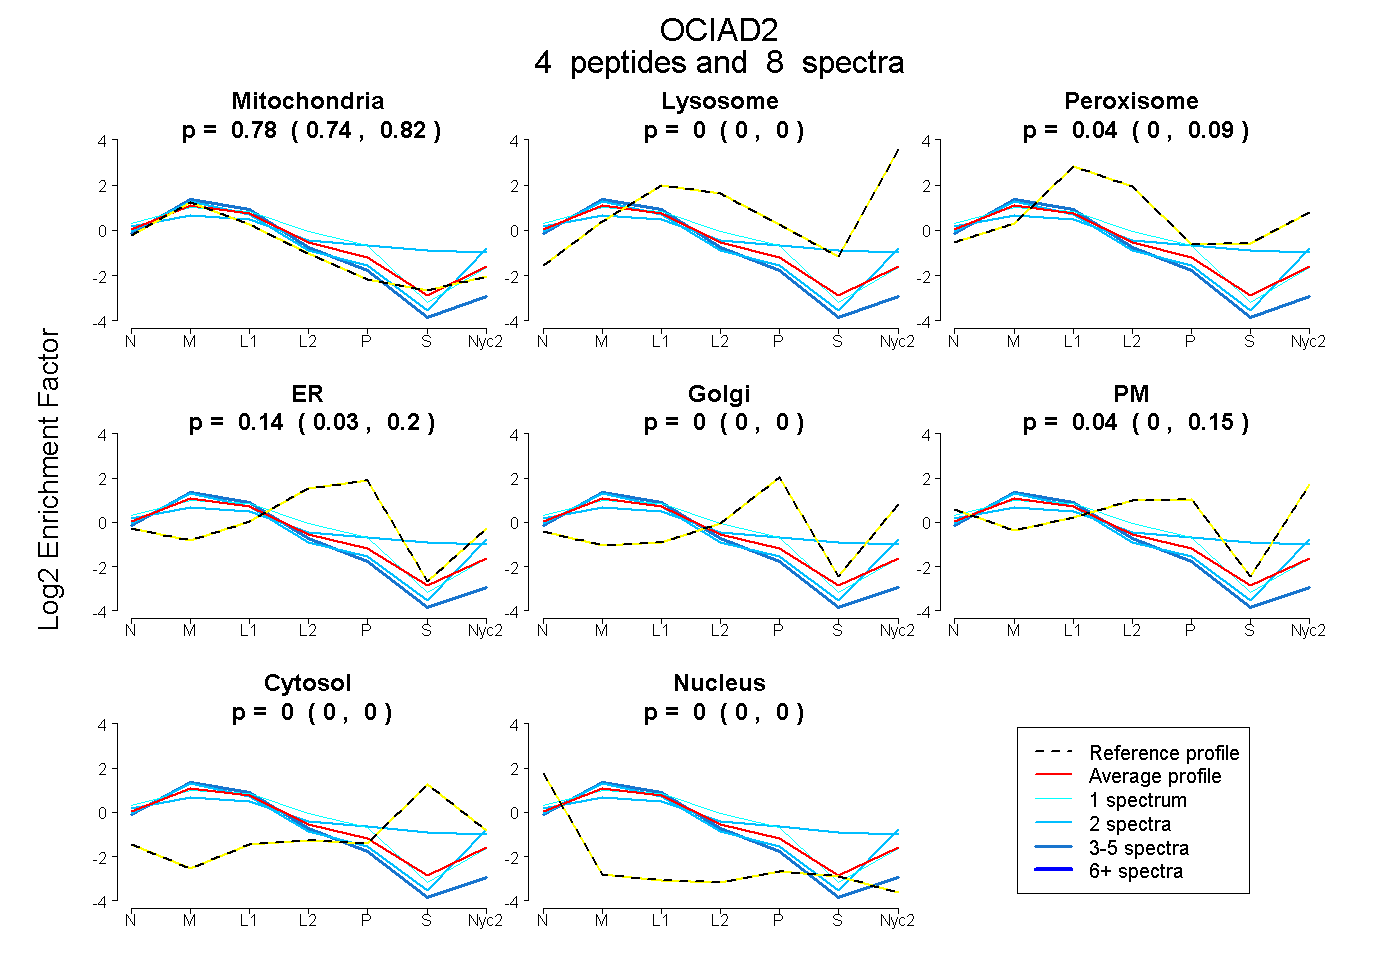
| Expt A |
4 peptides |
8 spectra |
|
0.779 0.736 | 0.818 |
0.000 0.000 | 0.000 |
0.039 0.000 | 0.091 |
0.141 0.032 | 0.199 |
0.000 0.000 | 0.000 |
0.042 0.000 | 0.151 |
0.000 0.000 | 0.000 |
0.000 0.000 | 0.000 |
| 3 spectra, ECQEESFWK | 0.984 | 0.000 | 0.000 | 0.016 | 0.000 | 0.000 | 0.000 | 0.000 | ||
| 1 spectrum, QSLLFCPK | 0.675 | 0.000 | 0.026 | 0.300 | 0.000 | 0.000 | 0.000 | 0.000 | ||
| 2 spectra, GAGFGPEHNR | 0.475 | 0.000 | 0.230 | 0.000 | 0.091 | 0.053 | 0.152 | 0.000 | ||
| 2 spectra, FHSFEDQLR | 0.786 | 0.041 | 0.000 | 0.000 | 0.000 | 0.173 | 0.000 | 0.000 |
| Plot | Mito | Lyso or Perox | ER | Golgi | PM | Cytosol | Nucleus | ||||||
| Expt B |
1 peptide |
6 spectra |
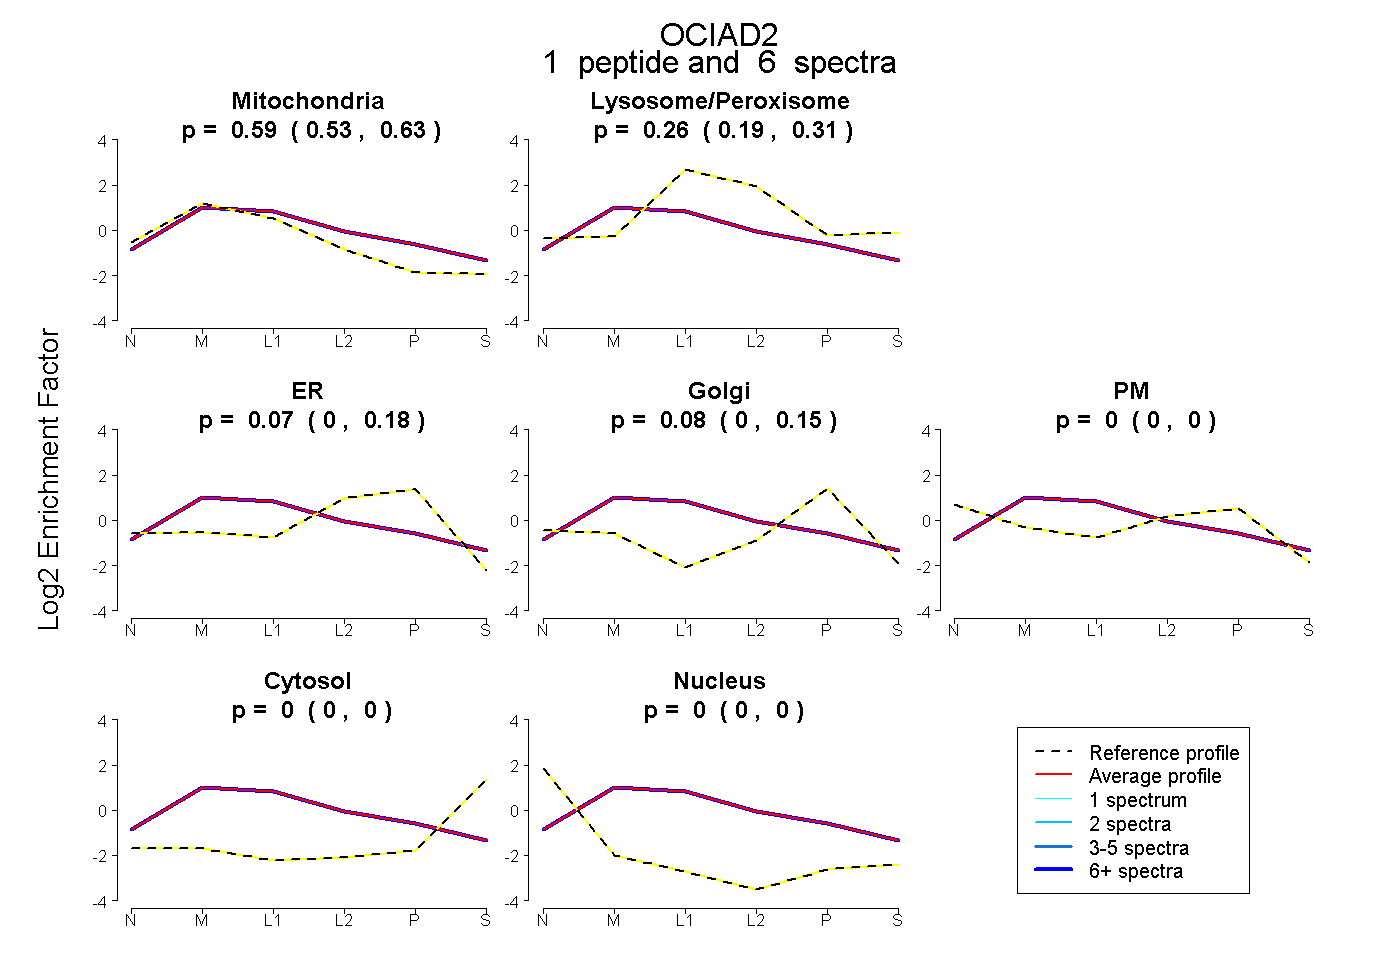 |
0.586 0.534 | 0.633 |
0.257 0.187 | 0.306 |
0.073 0.000 | 0.182 |
0.085 0.000 | 0.149 |
0.000 0.000 | 0.000 |
0.000 0.000 | 0.000 |
0.000 0.000 | 0.000 |
|||
| Plot | Lyso | Other | |||||||||||
| Expt C |
4 peptides |
23 spectra |
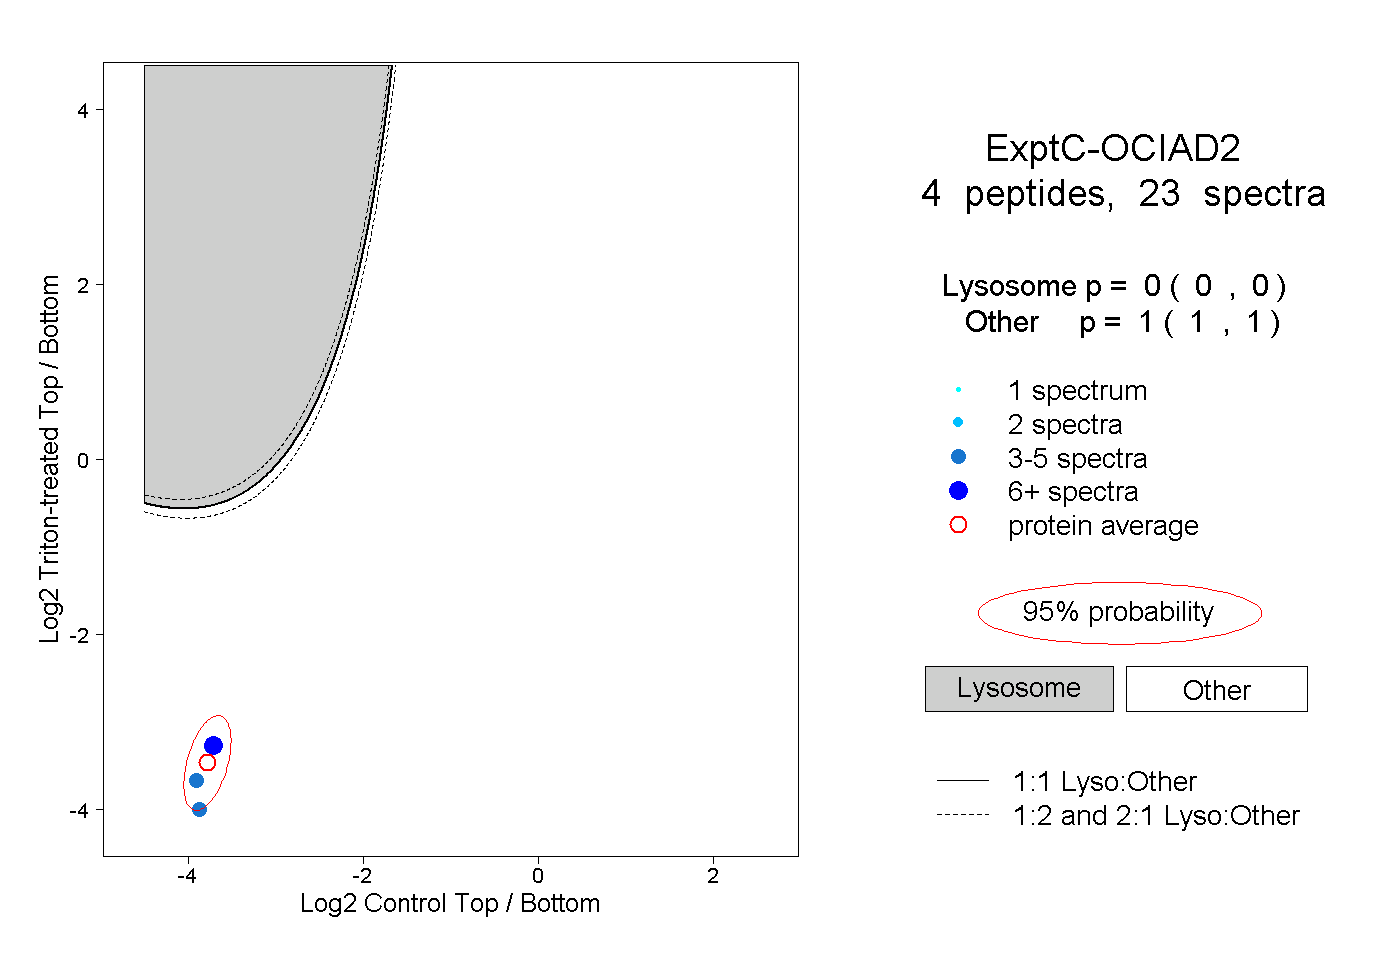 |
0.000 0.000 | 0.000 |
1.000 1.000 | 1.000 |