 8
8peptides
spectra
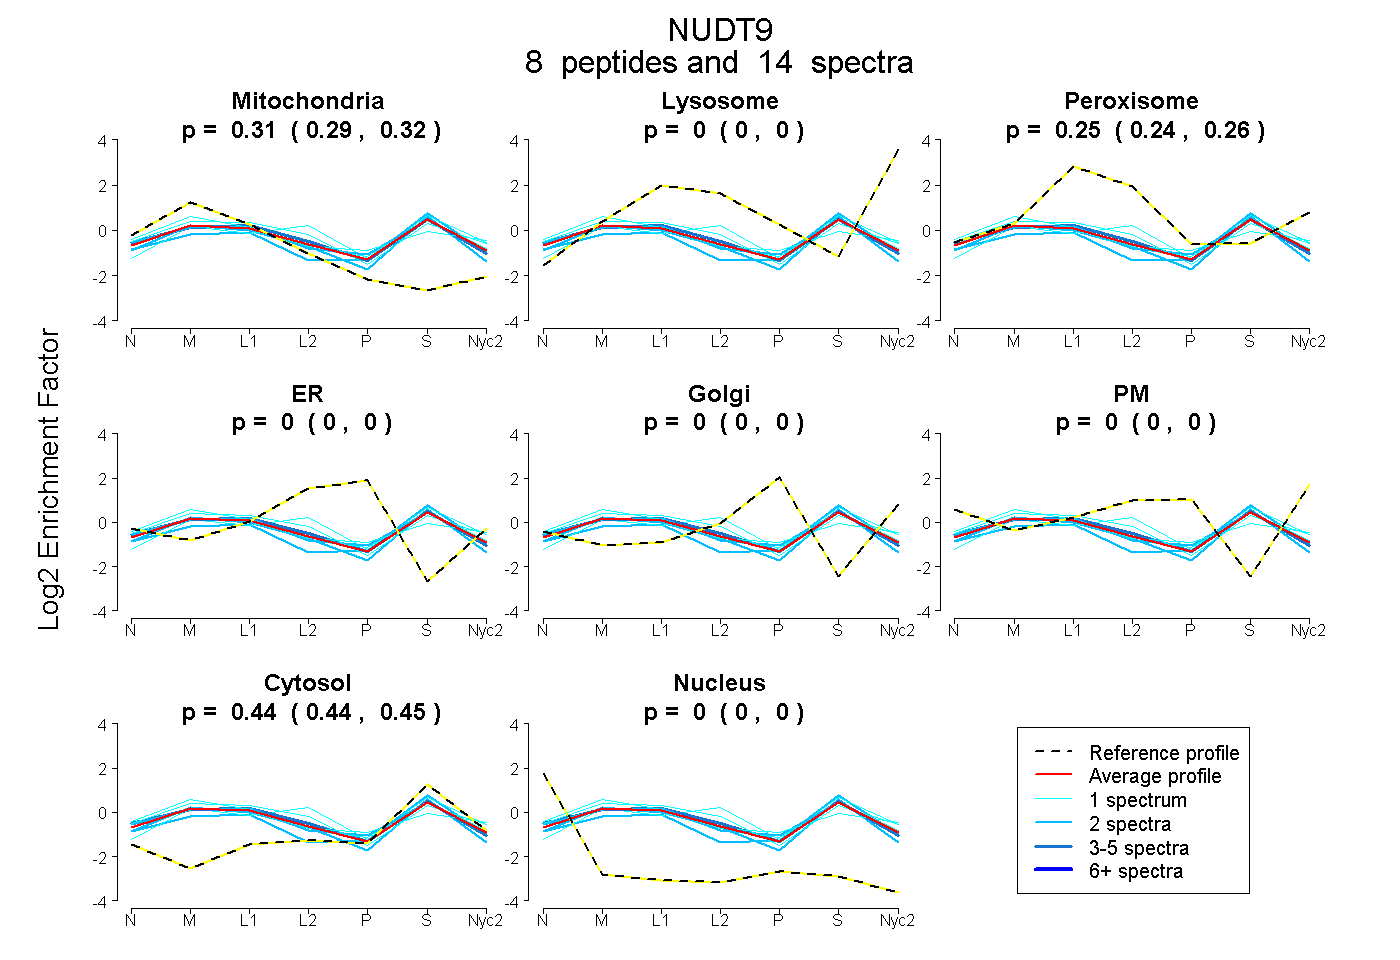
0.294 | 0.316
0.000 | 0.000
0.237 | 0.259
0.000 | 0.000
0.000 | 0.000
0.000 | 0.000
0.437 | 0.451
0.000 | 0.000
2peptides
spectra
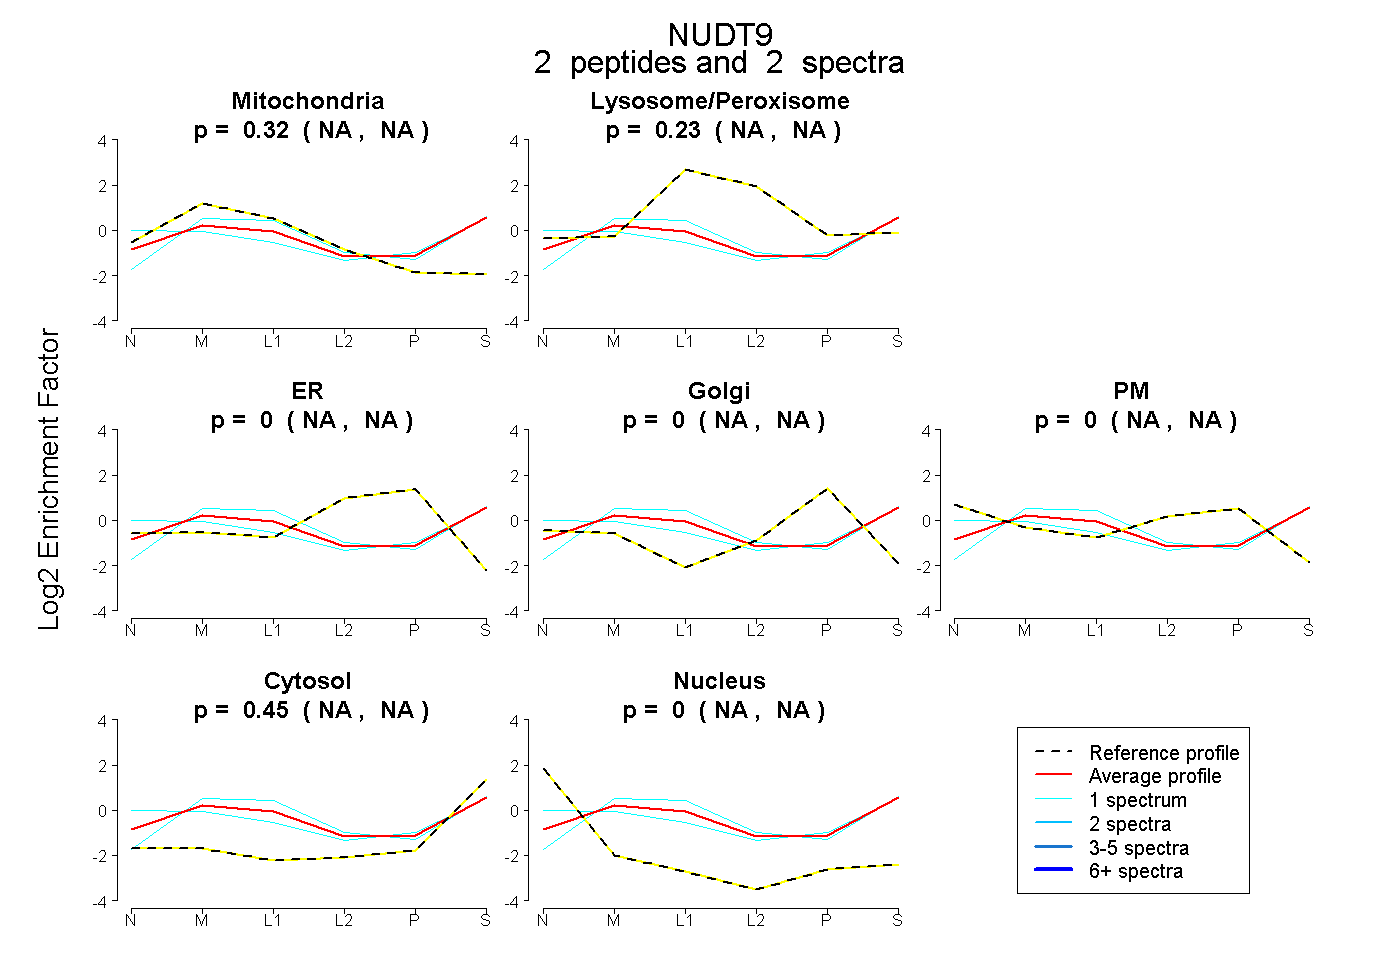
NA | NA
NA | NA
NA | NA
NA | NA
NA | NA
NA | NA
NA | NA
13peptides
spectra
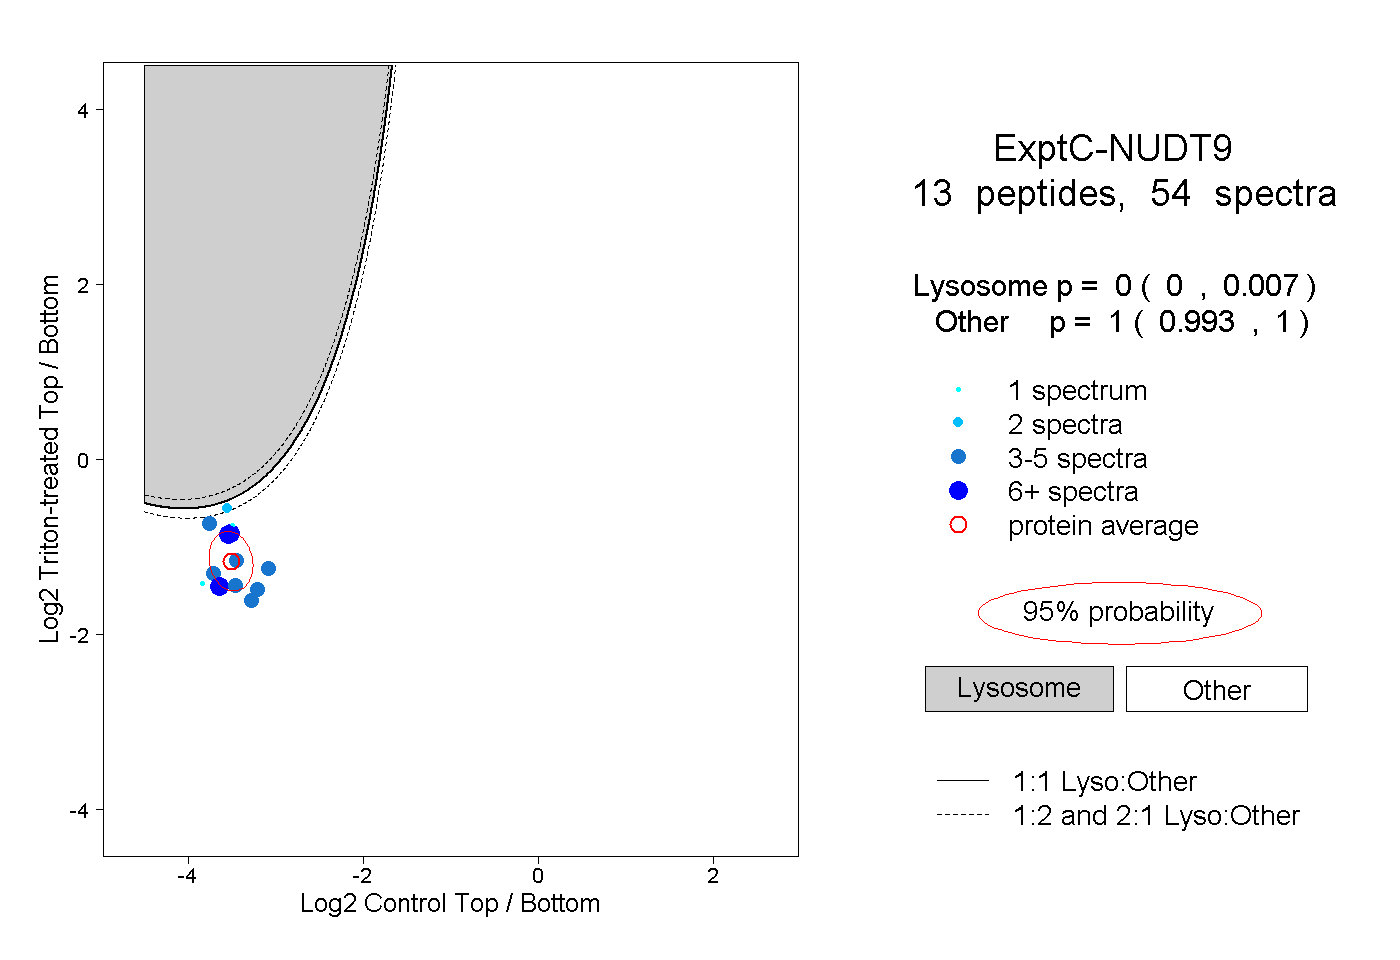
0.000 | 0.007
0.993 | 1.000
1peptide
spectrum
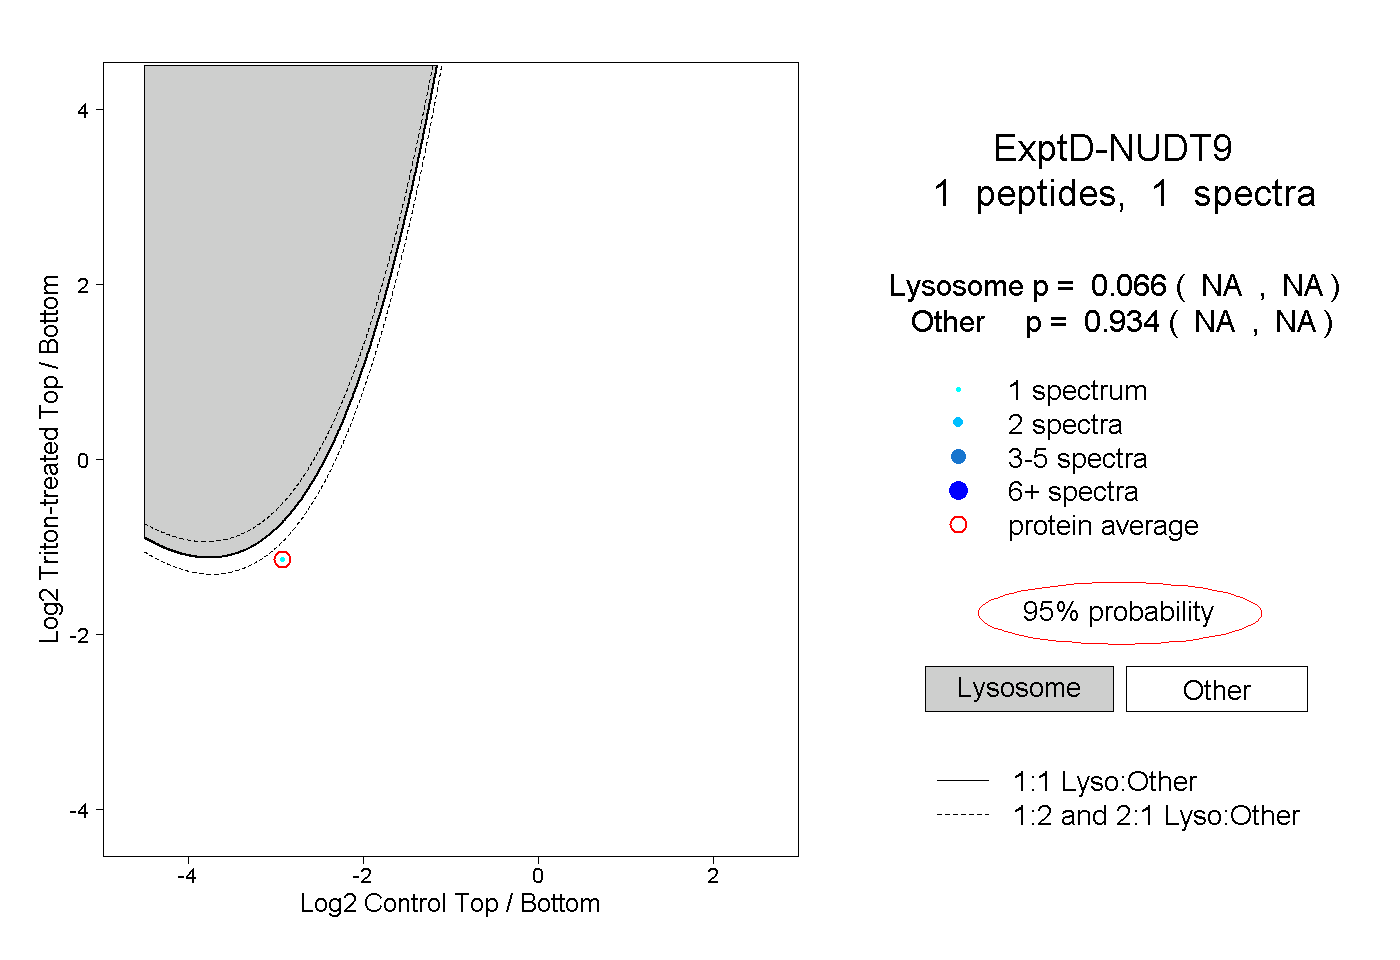
NA | NA
NA | NA