 8
8peptides
spectra
0.294 | 0.316
0.000 | 0.000
0.237 | 0.259
0.000 | 0.000
0.000 | 0.000
0.000 | 0.000
0.437 | 0.451
0.000 | 0.000
| Plot | Mito | Lyso | Perox | ER | Golgi | PM | Cytosol | Nucleus | |||||
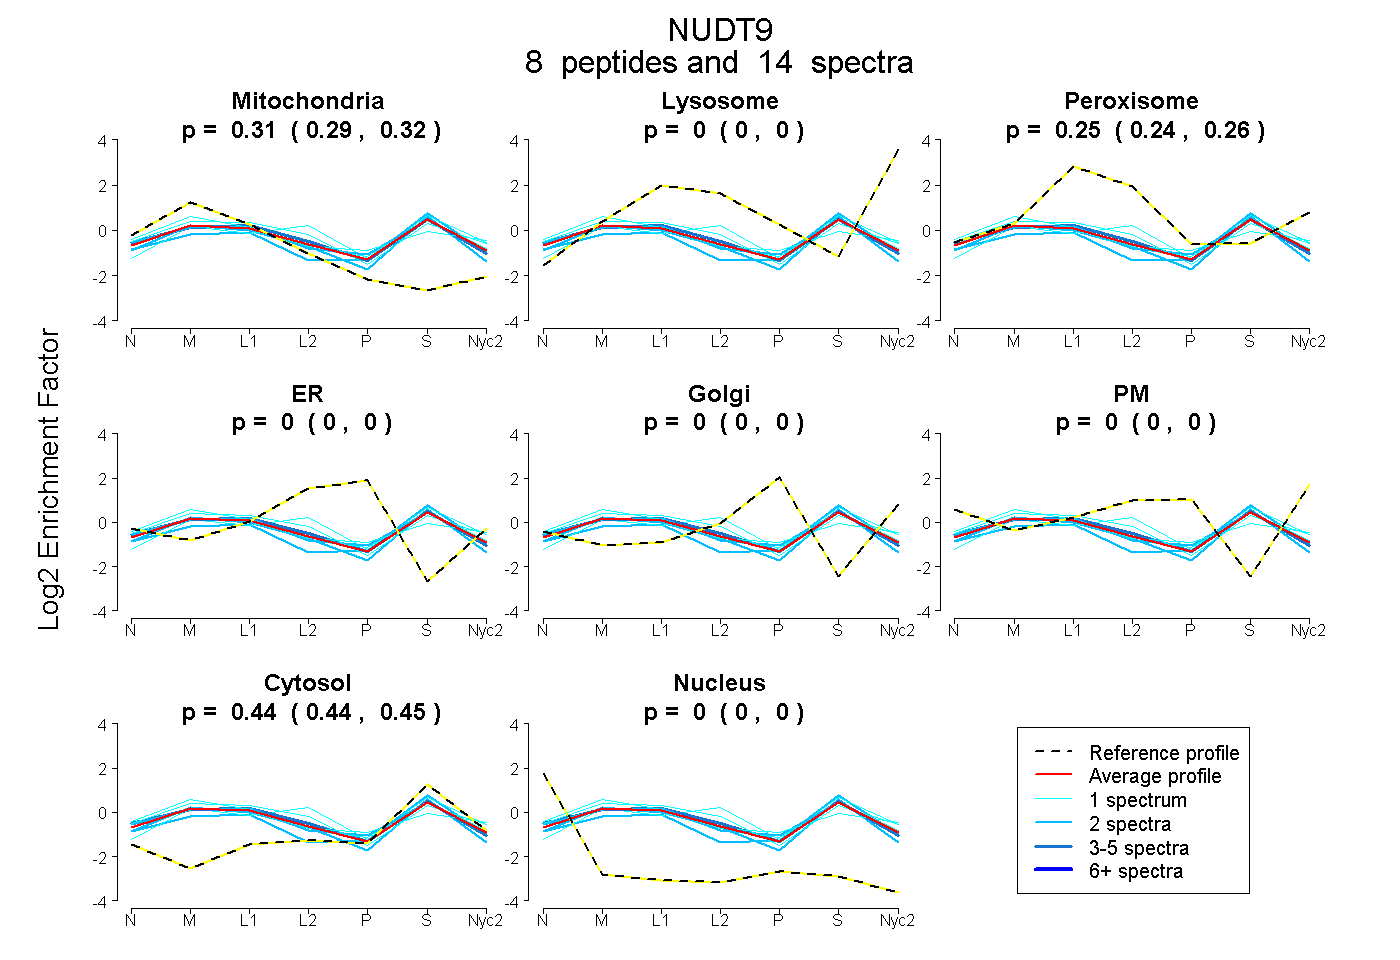
| Expt A |
8 peptides |
14 spectra |
|
0.306 0.294 | 0.316 |
0.000 0.000 | 0.000 |
0.249 0.237 | 0.259 |
0.000 0.000 | 0.000 |
0.000 0.000 | 0.000 |
0.000 0.000 | 0.000 |
0.445 0.437 | 0.451 |
0.000 0.000 | 0.000 |
| 1 spectrum, EFGEEALNSLQK | 0.172 | 0.013 | 0.343 | 0.000 | 0.000 | 0.000 | 0.472 | 0.000 | ||
| 2 spectra, CILQFVAIK | 0.286 | 0.000 | 0.147 | 0.000 | 0.000 | 0.000 | 0.567 | 0.000 | ||
| 2 spectra, LYASHSQFIK | 0.302 | 0.000 | 0.251 | 0.000 | 0.000 | 0.000 | 0.447 | 0.000 | ||
| 4 spectra, GYVDDPR | 0.301 | 0.000 | 0.263 | 0.000 | 0.000 | 0.000 | 0.436 | 0.000 | ||
| 1 spectrum, WGPNHAADPIITR | 0.388 | 0.128 | 0.141 | 0.000 | 0.000 | 0.004 | 0.338 | 0.000 | ||
| 1 spectrum, WVDISDQLK | 0.297 | 0.000 | 0.342 | 0.000 | 0.000 | 0.000 | 0.361 | 0.000 | ||
| 2 spectra, DNSHNK | 0.362 | 0.000 | 0.171 | 0.000 | 0.000 | 0.000 | 0.467 | 0.000 | ||
| 1 spectrum, ITHPVSGK | 0.307 | 0.000 | 0.245 | 0.000 | 0.000 | 0.000 | 0.449 | 0.000 |
| Plot | Mito | Lyso or Perox | ER | Golgi | PM | Cytosol | Nucleus | ||||||
| Expt B |
2 peptides |
2 spectra |
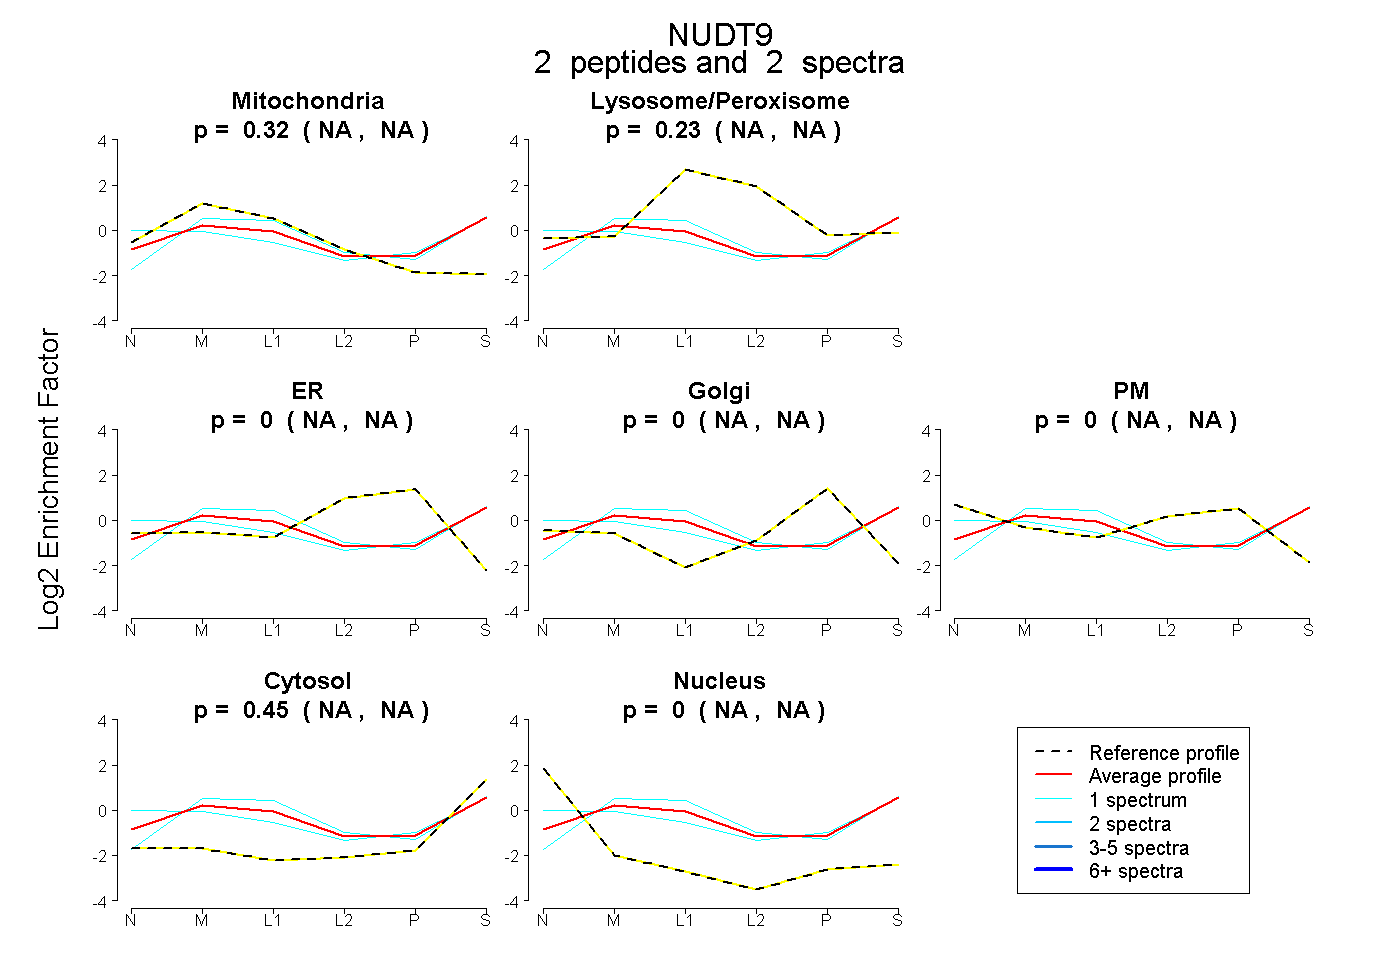 |
0.324 NA | NA |
0.226 NA | NA |
0.000 NA | NA |
0.000 NA | NA |
0.000 NA | NA |
0.450 NA | NA |
0.000 NA | NA |
|||
| Plot | Lyso | Other | |||||||||||
| Expt C |
13 peptides |
54 spectra |
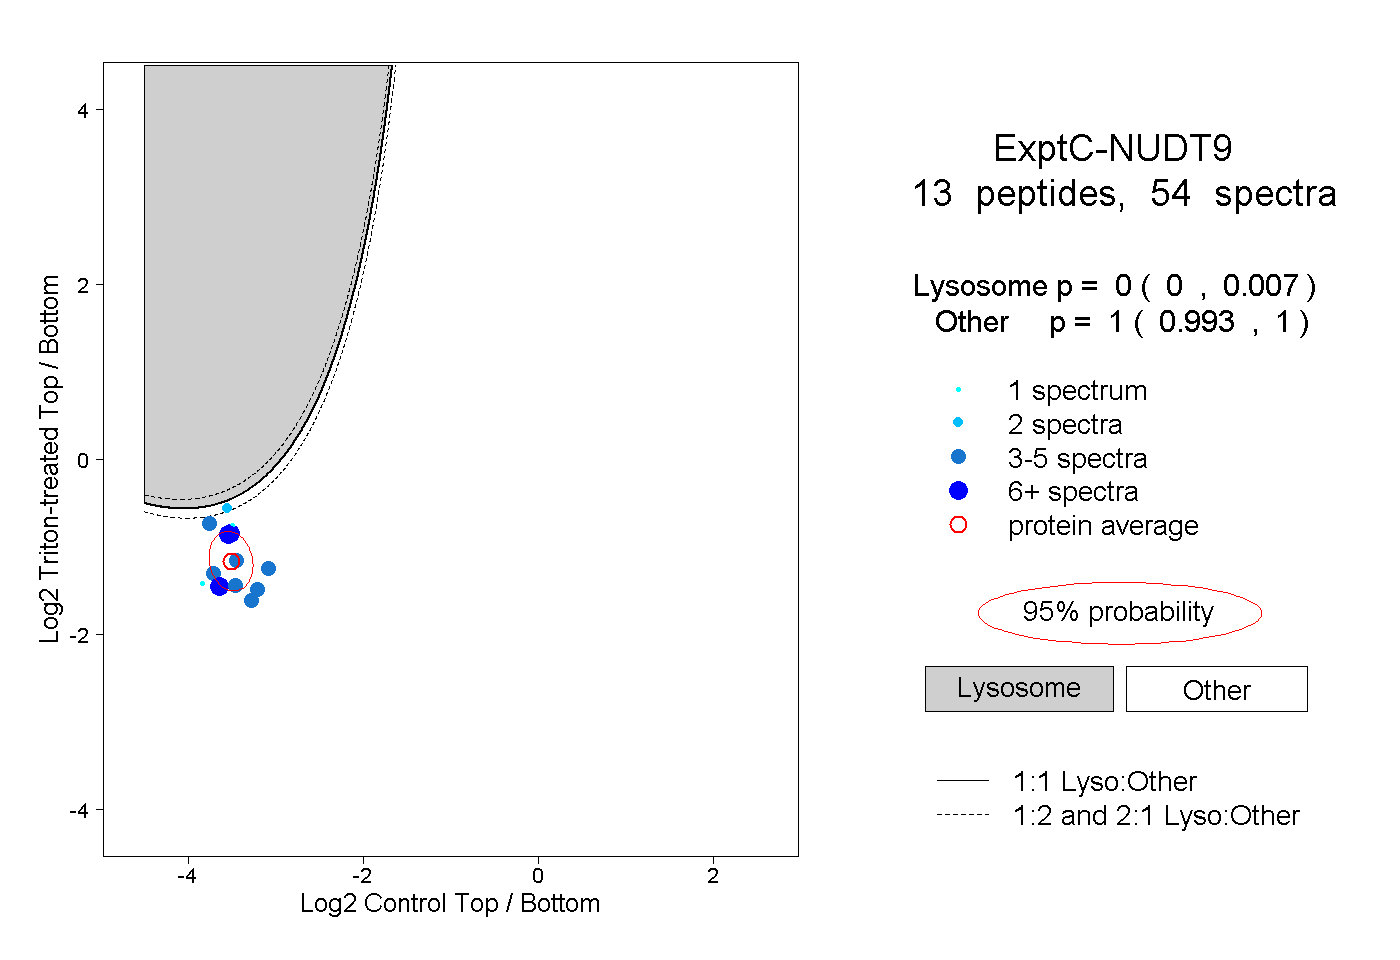 |
0.000 0.000 | 0.007 |
1.000 0.993 | 1.000 |
||||||||
| Plot | Lyso | Other | |||||||||||
| Expt D |
1 peptide |
1 spectrum |
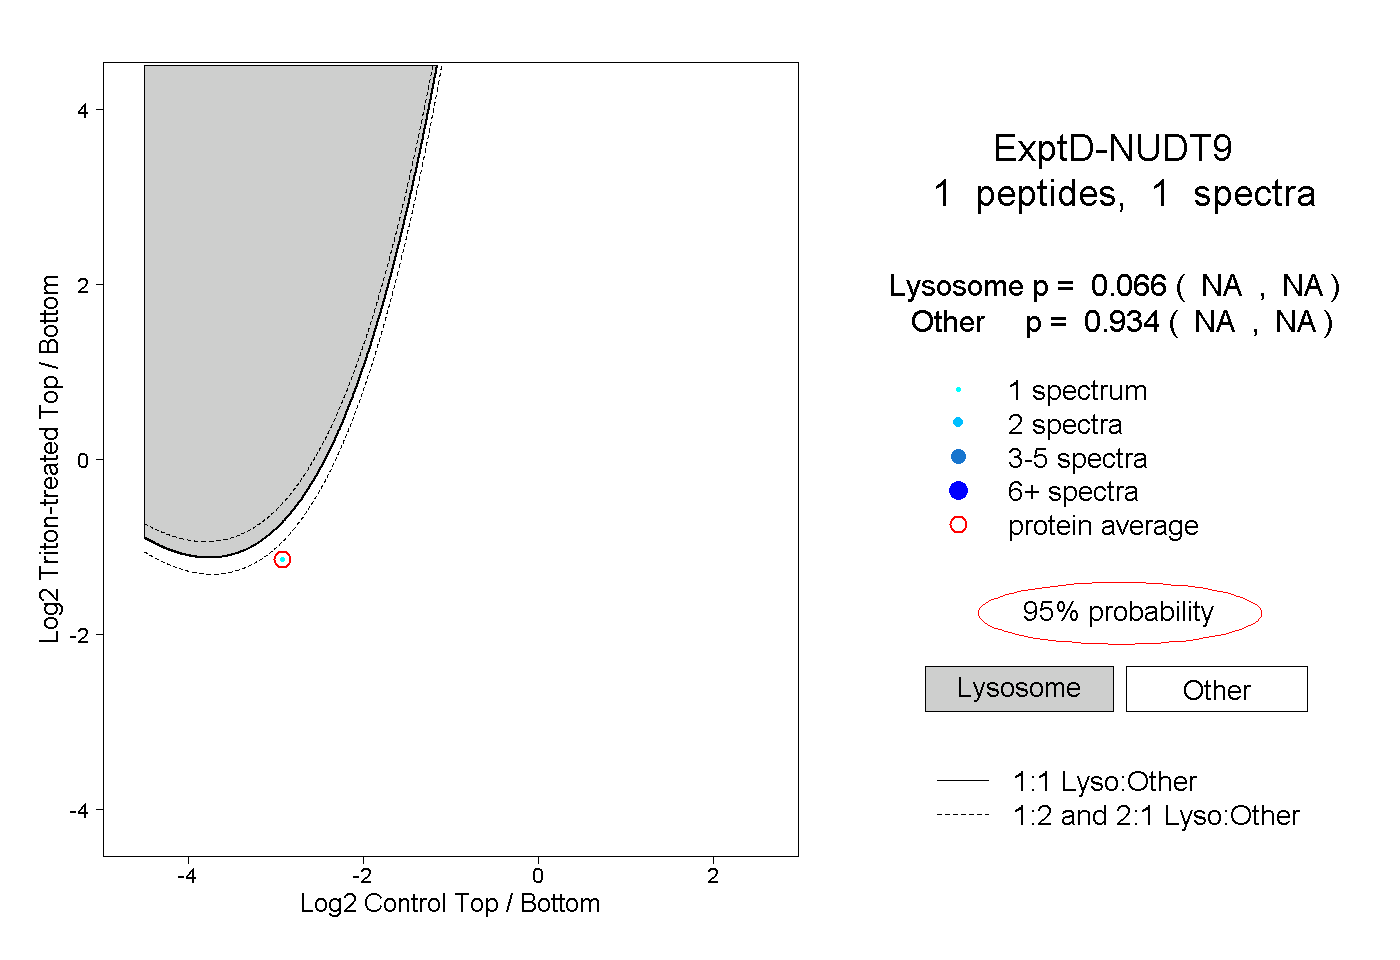 |
0.066 NA | NA |
0.934 NA | NA |