 13
13peptides
spectra
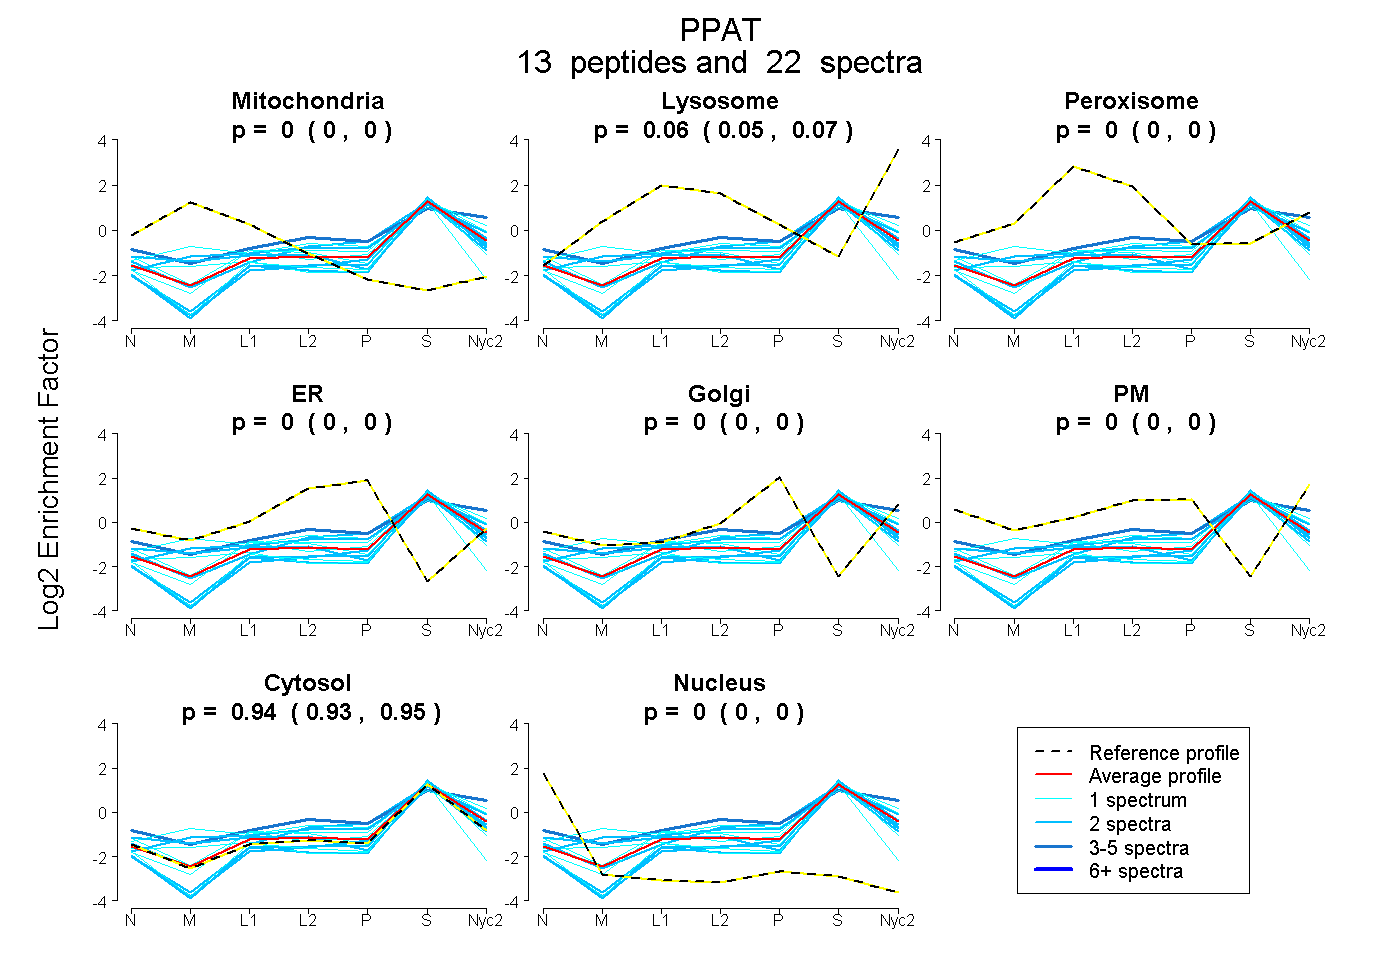
0.000 | 0.000
0.052 | 0.070
0.000 | 0.000
0.000 | 0.000
0.000 | 0.000
0.000 | 0.000
0.928 | 0.946
0.000 | 0.000
6peptides
spectra
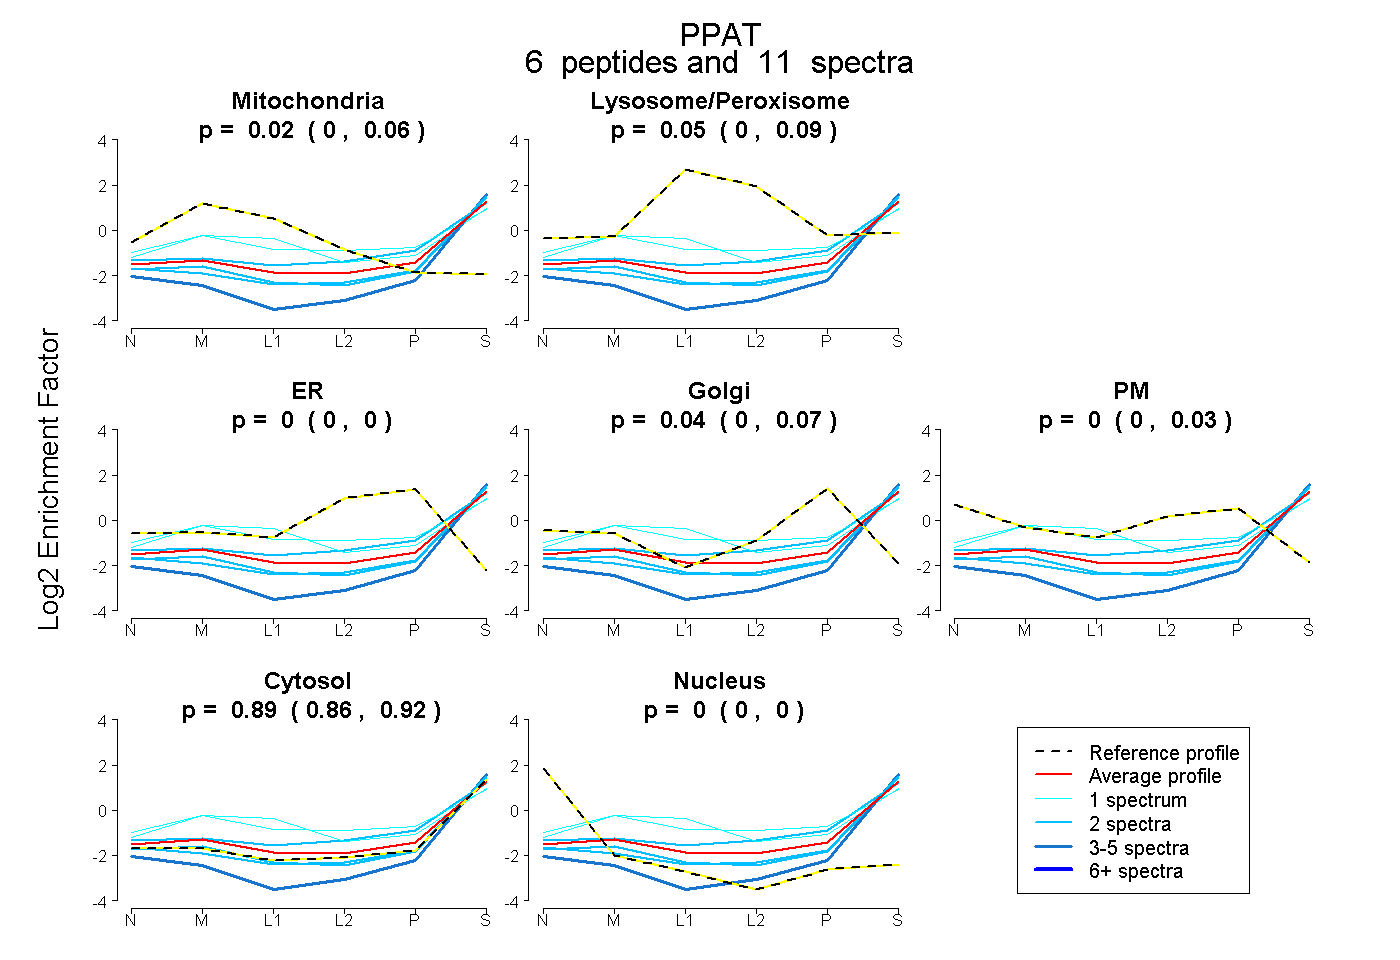
0.000 | 0.061
0.005 | 0.088
0.000 | 0.000
0.000 | 0.065
0.000 | 0.025
0.861 | 0.917
0.000 | 0.000
7peptides
spectra
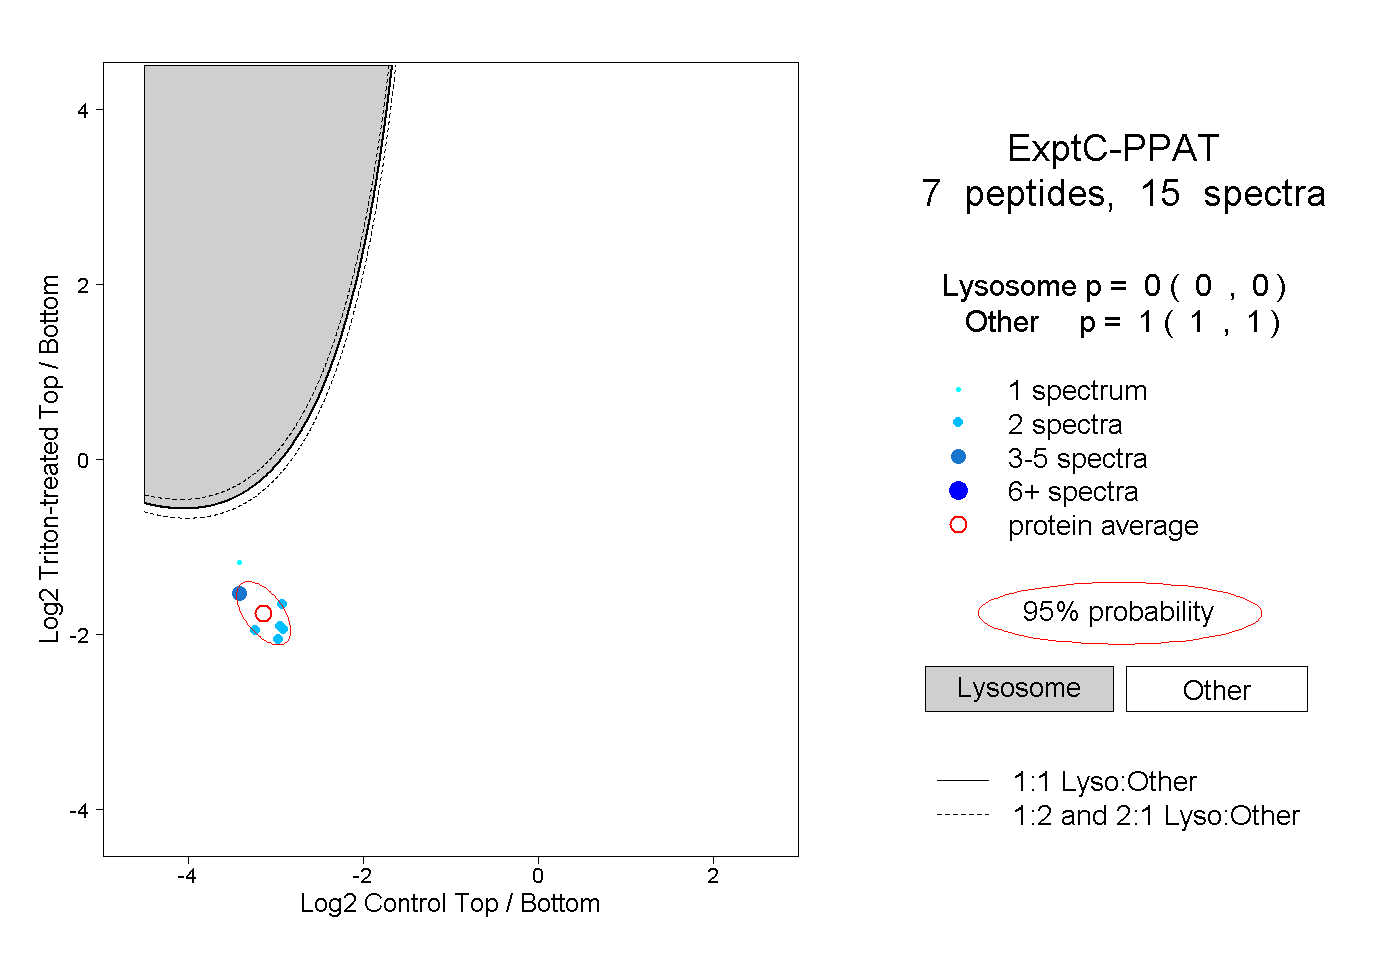
0.000 | 0.000
1.000 | 1.000