 13
13peptides
spectra
0.000 | 0.000
0.052 | 0.070
0.000 | 0.000
0.000 | 0.000
0.000 | 0.000
0.000 | 0.000
0.928 | 0.946
0.000 | 0.000
| Plot | Mito | Lyso | Perox | ER | Golgi | PM | Cytosol | Nucleus | |||||
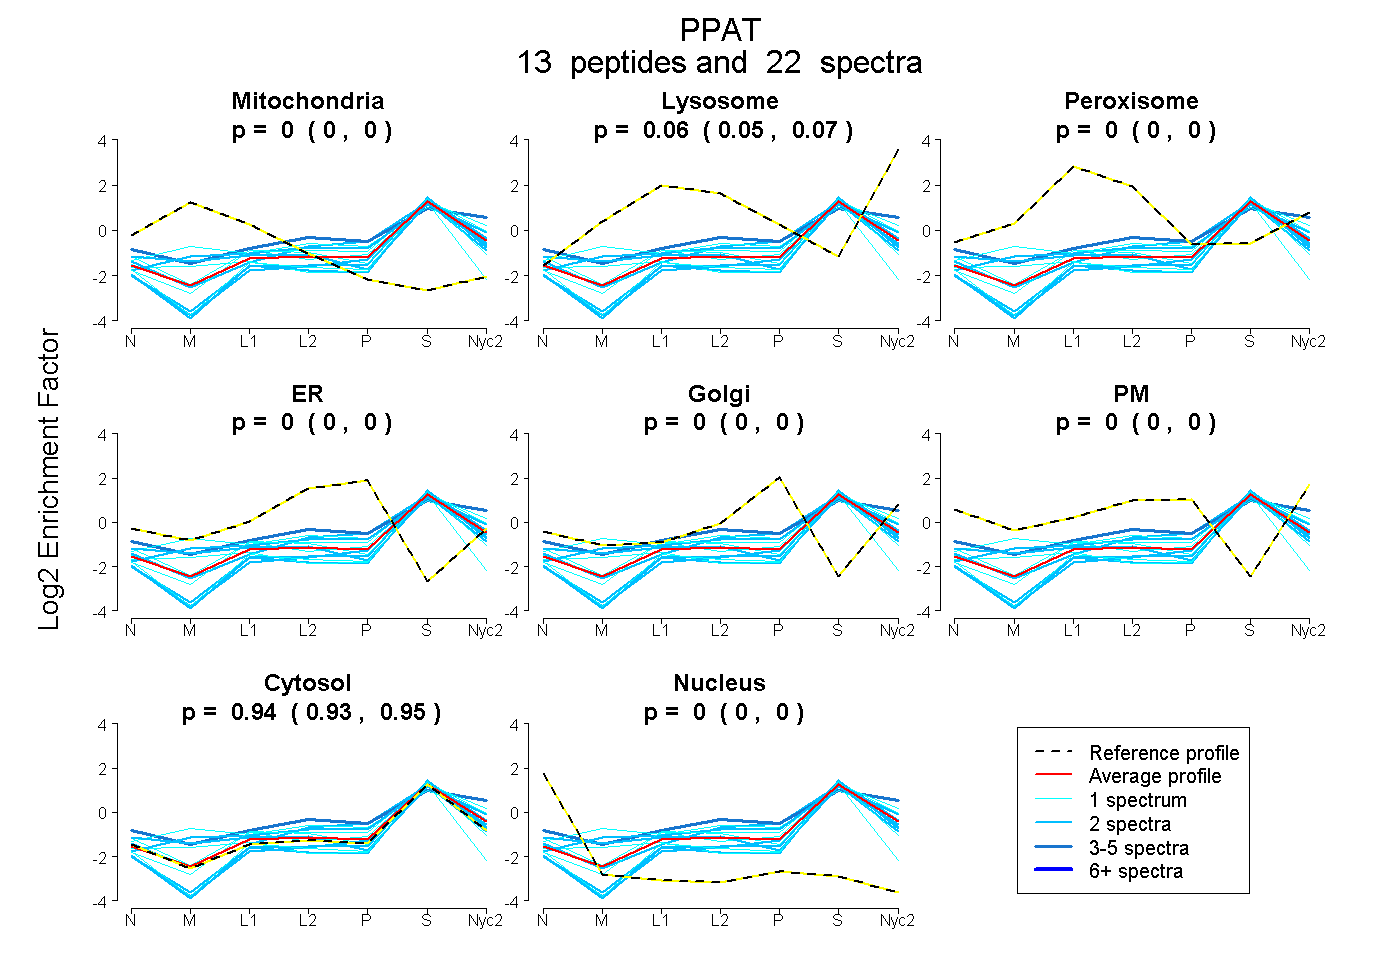
| Expt A |
13 peptides |
22 spectra |
|
0.000 0.000 | 0.000 |
0.062 0.052 | 0.070 |
0.000 0.000 | 0.000 |
0.000 0.000 | 0.000 |
0.000 0.000 | 0.000 |
0.000 0.000 | 0.000 |
0.938 0.928 | 0.946 |
0.000 0.000 | 0.000 |
| 2 spectra, DPYGNRPLCIGR | 0.000 | 0.000 | 0.000 | 0.115 | 0.000 | 0.000 | 0.885 | 0.000 | ||
| 2 spectra, VASPPIK | 0.000 | 0.000 | 0.000 | 0.000 | 0.000 | 0.000 | 1.000 | 0.000 | ||
| 1 spectrum, YCHEVKPGEIVEISR | 0.000 | 0.000 | 0.000 | 0.000 | 0.000 | 0.000 | 0.991 | 0.009 | ||
| 1 spectrum, TFIQPNMR | 0.000 | 0.092 | 0.000 | 0.000 | 0.000 | 0.000 | 0.908 | 0.000 | ||
| 2 spectra, IAVAHNGELVNAAR | 0.019 | 0.198 | 0.000 | 0.000 | 0.000 | 0.000 | 0.783 | 0.000 | ||
| 2 spectra, DVIYAVR | 0.000 | 0.000 | 0.000 | 0.000 | 0.000 | 0.000 | 1.000 | 0.000 | ||
| 2 spectra, IVLIDDSIVR | 0.000 | 0.000 | 0.000 | 0.000 | 0.000 | 0.000 | 1.000 | 0.000 | ||
| 1 spectrum, FGVLSDNFK | 0.089 | 0.204 | 0.000 | 0.000 | 0.012 | 0.000 | 0.695 | 0.000 | ||
| 2 spectra, TLDIIPR | 0.110 | 0.038 | 0.032 | 0.000 | 0.000 | 0.000 | 0.820 | 0.000 | ||
| 1 spectrum, CGLPYVEVLCK | 0.058 | 0.000 | 0.000 | 0.000 | 0.000 | 0.000 | 0.891 | 0.052 | ||
| 4 spectra, EAPAAYSLVIMHR | 0.000 | 0.205 | 0.000 | 0.000 | 0.000 | 0.111 | 0.685 | 0.000 | ||
| 1 spectrum, GNTISPIIK | 0.073 | 0.019 | 0.000 | 0.000 | 0.000 | 0.000 | 0.909 | 0.000 | ||
| 1 spectrum, HPCFMGINIPTK | 0.000 | 0.153 | 0.000 | 0.000 | 0.000 | 0.000 | 0.847 | 0.000 |
| Plot | Mito | Lyso or Perox | ER | Golgi | PM | Cytosol | Nucleus | ||||||
| Expt B |
6 peptides |
11 spectra |
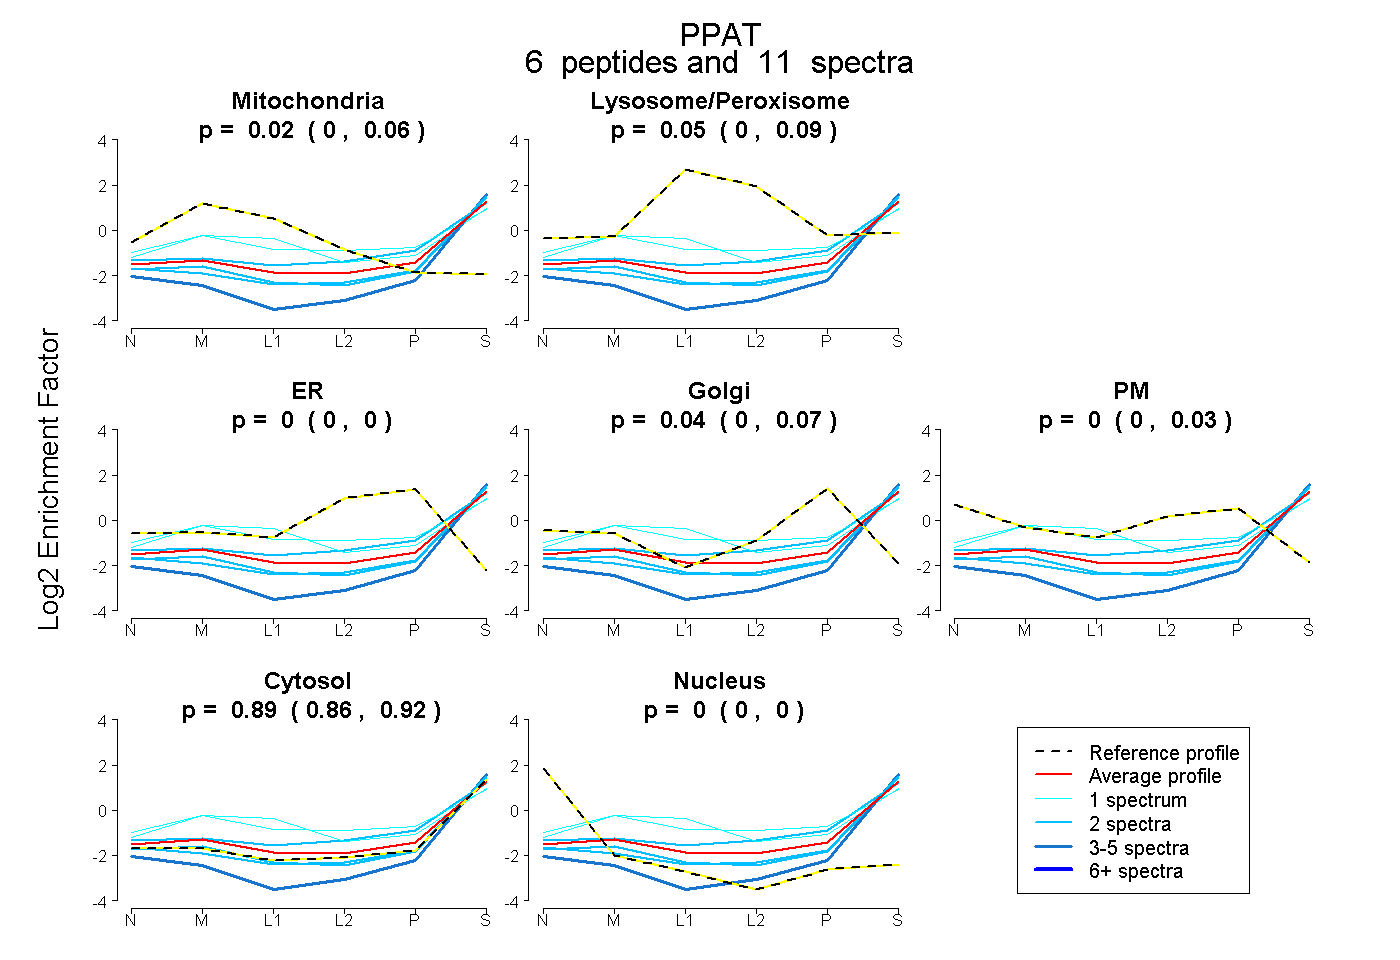 |
0.019 0.000 | 0.061 |
0.055 0.005 | 0.088 |
0.000 0.000 | 0.000 |
0.036 0.000 | 0.065 |
0.000 0.000 | 0.025 |
0.890 0.861 | 0.917 |
0.000 0.000 | 0.000 |
|||
| Plot | Lyso | Other | |||||||||||
| Expt C |
7 peptides |
15 spectra |
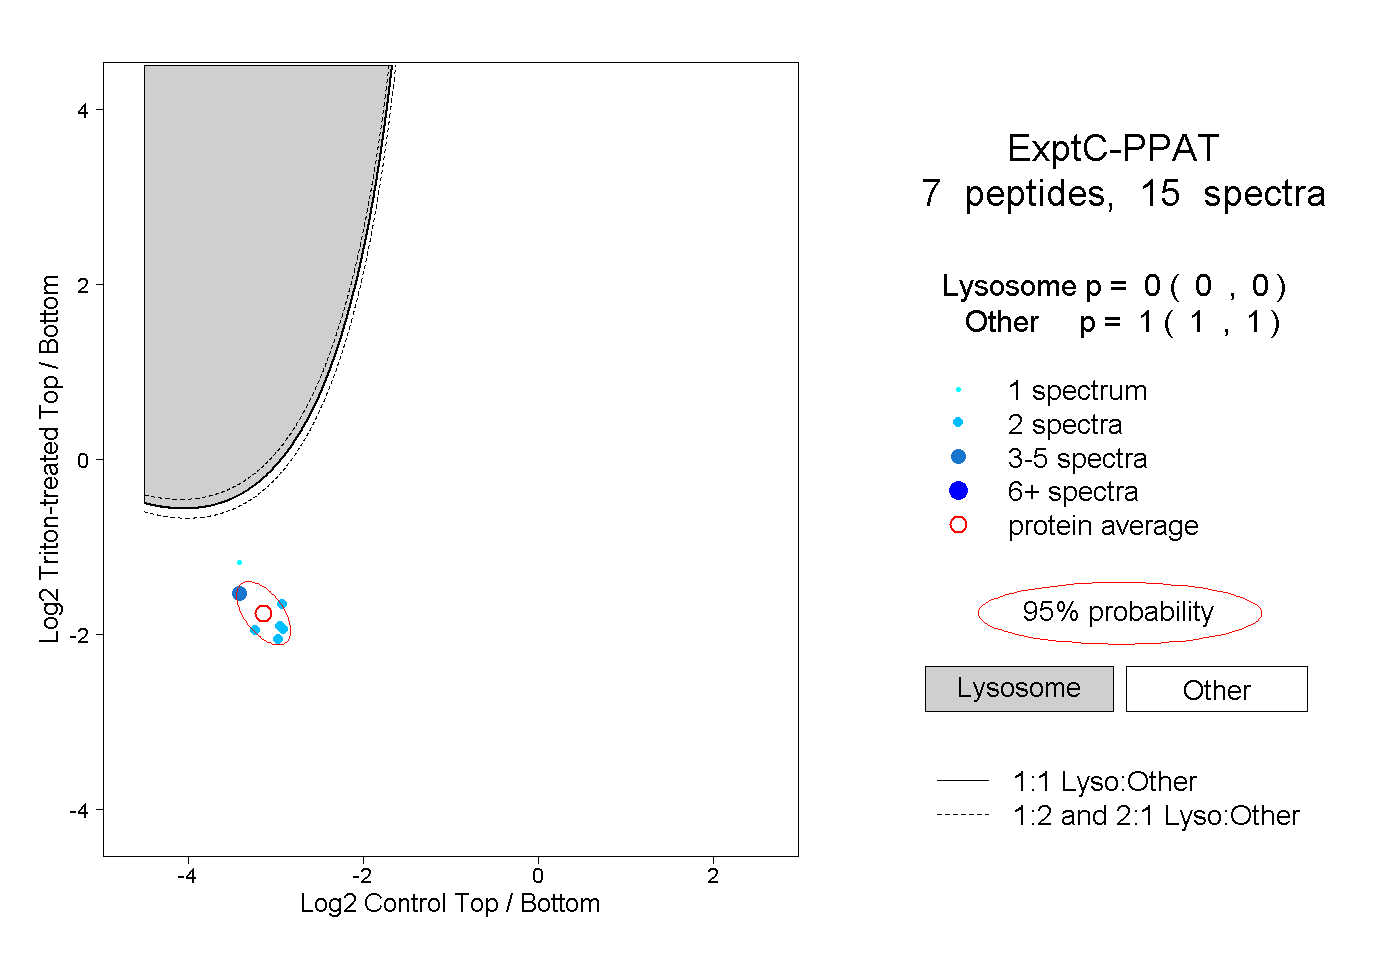 |
0.000 0.000 | 0.000 |
1.000 1.000 | 1.000 |