 18
18peptides
spectra
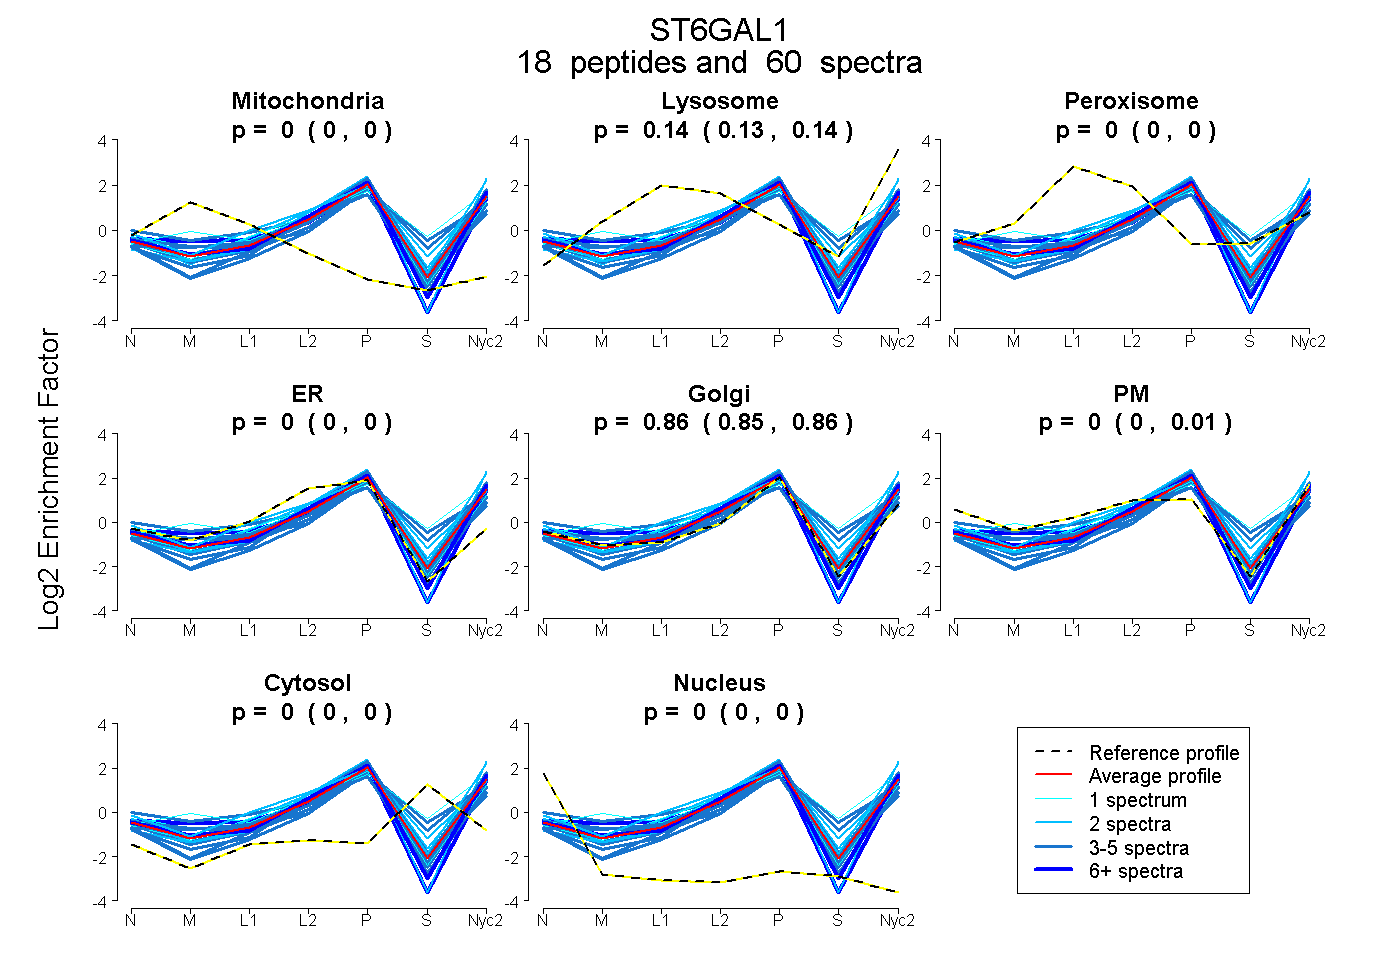
0.000 | 0.000
0.133 | 0.144
0.000 | 0.000
0.000 | 0.000
0.850 | 0.862
0.000 | 0.012
0.000 | 0.000
0.000 | 0.000
4peptides
spectra
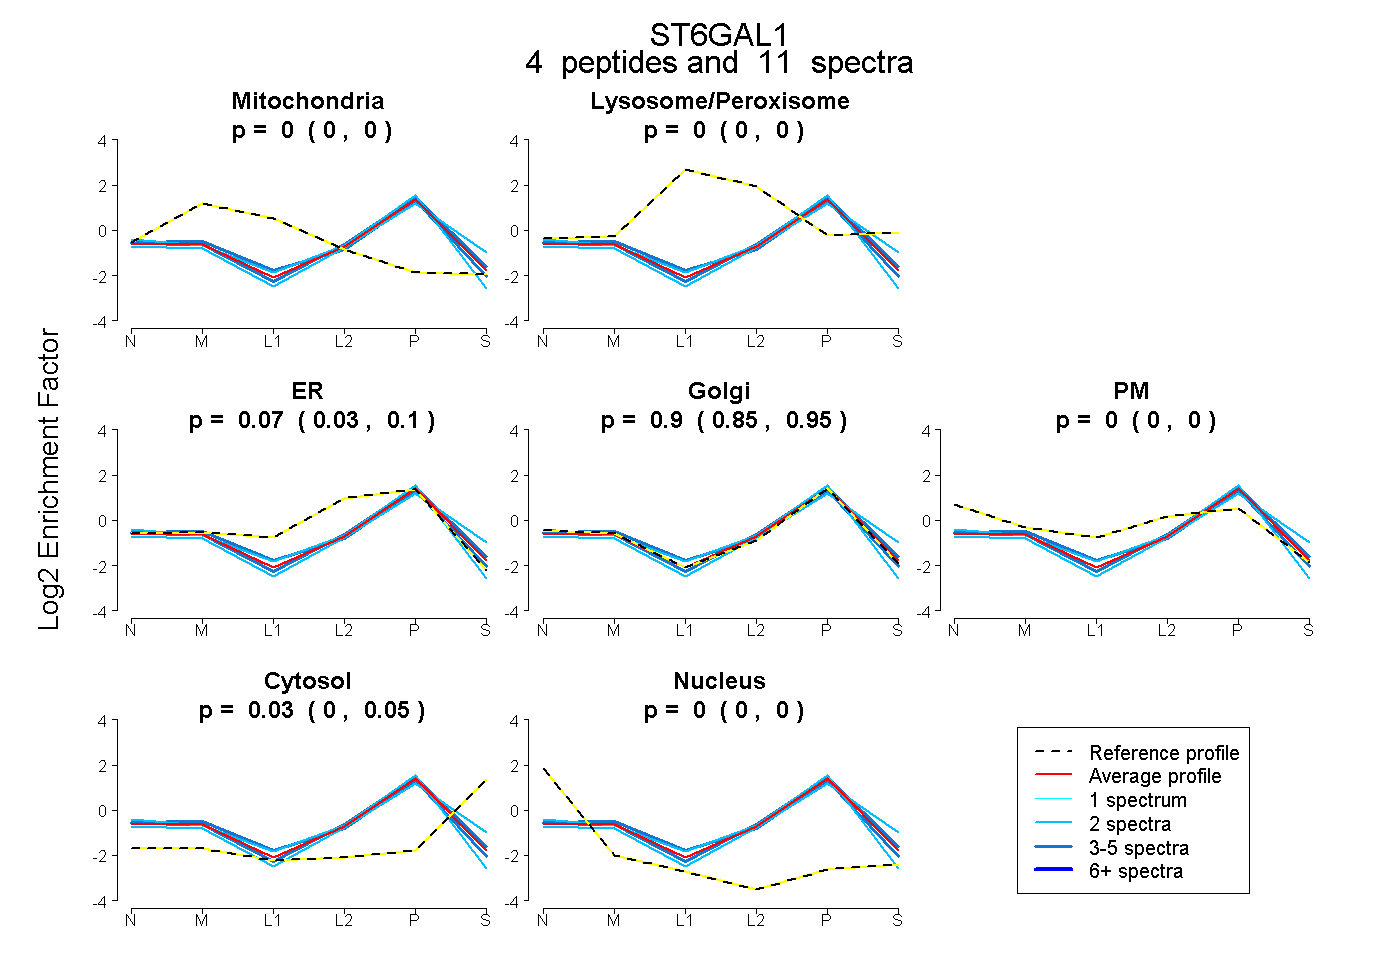
0.000 | 0.000
0.000 | 0.002
0.032 | 0.098
0.852 | 0.946
0.000 | 0.000
0.000 | 0.053
0.000 | 0.000
17peptides
spectra
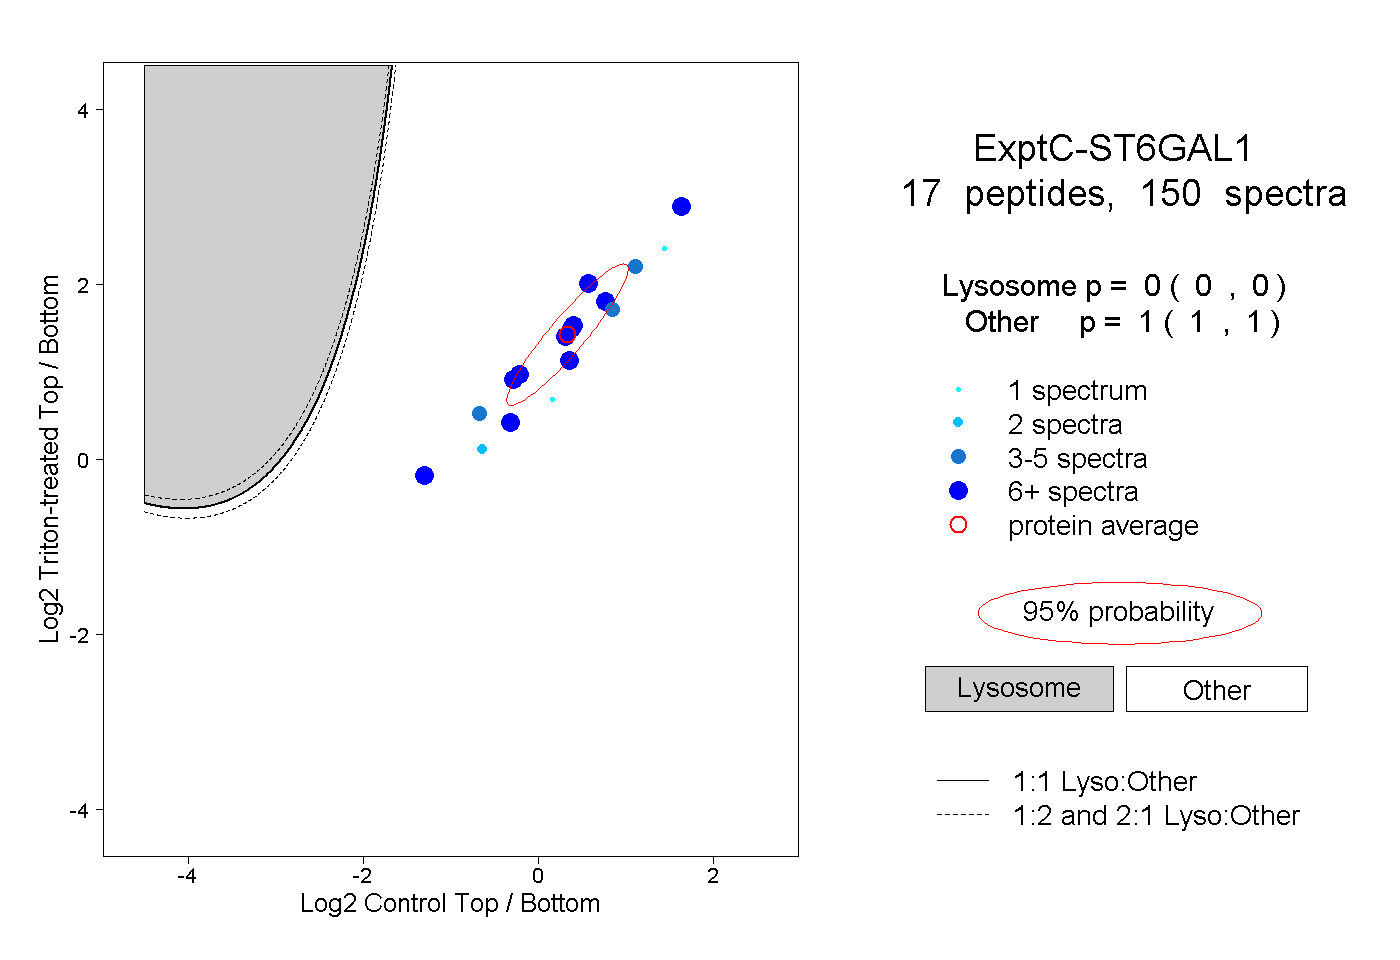
0.000 | 0.000
1.000 | 1.000
3peptides
spectra
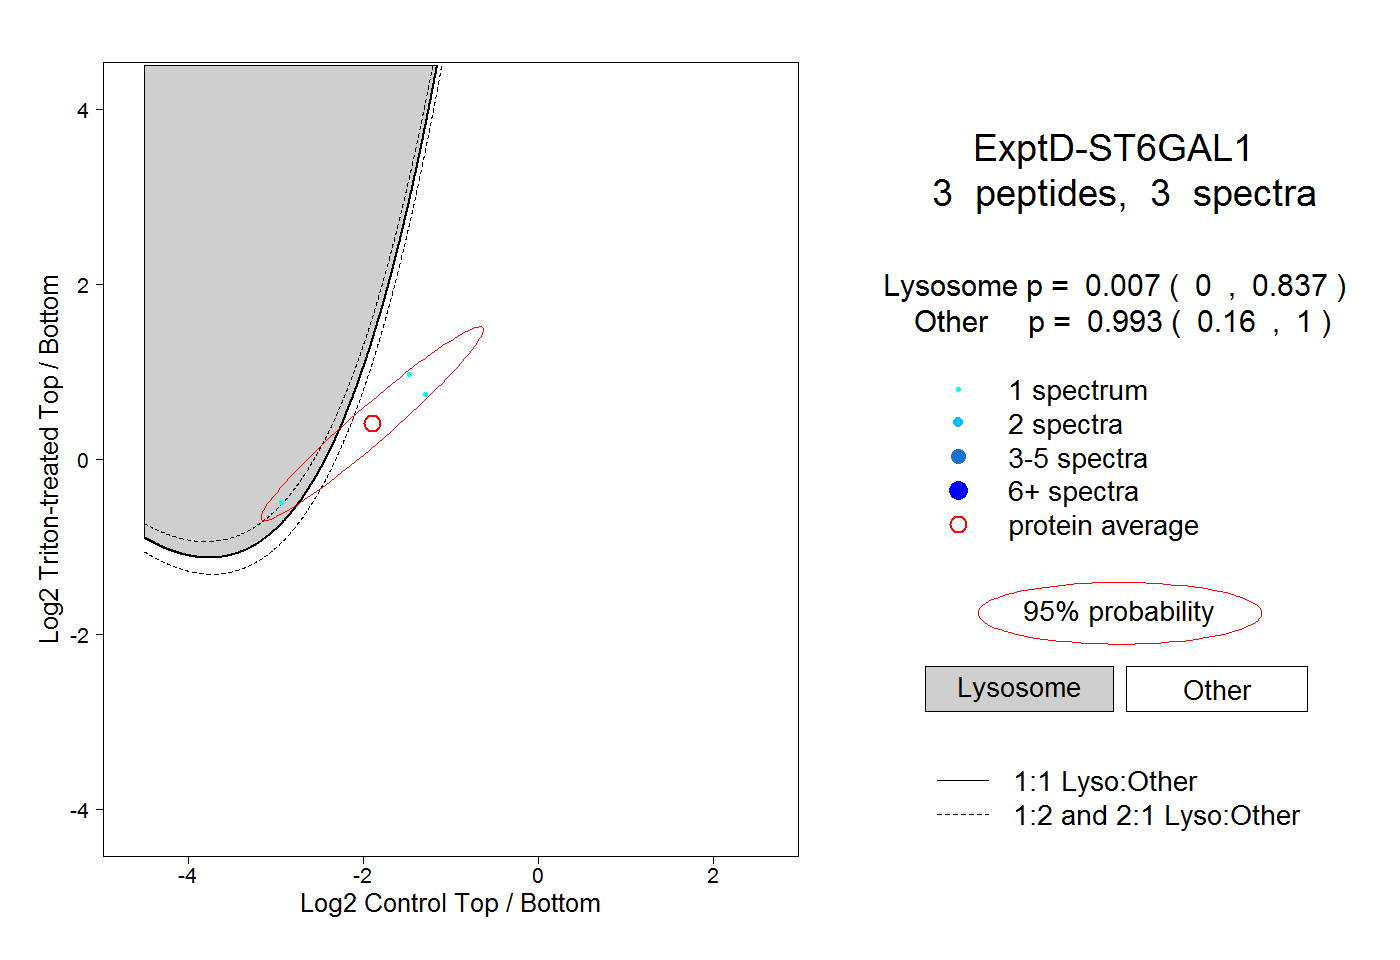
0.000 | 0.837
0.160 | 1.000