ST6GAL1
[ENSRNOP00000002499]
Main page
| | | Plot |
Mito |
Lyso |
|
Perox |
ER |
Golgi |
PM |
Cytosol |
Nucleus |
|
| Expt A |
 18
18
peptides |
60
spectra |
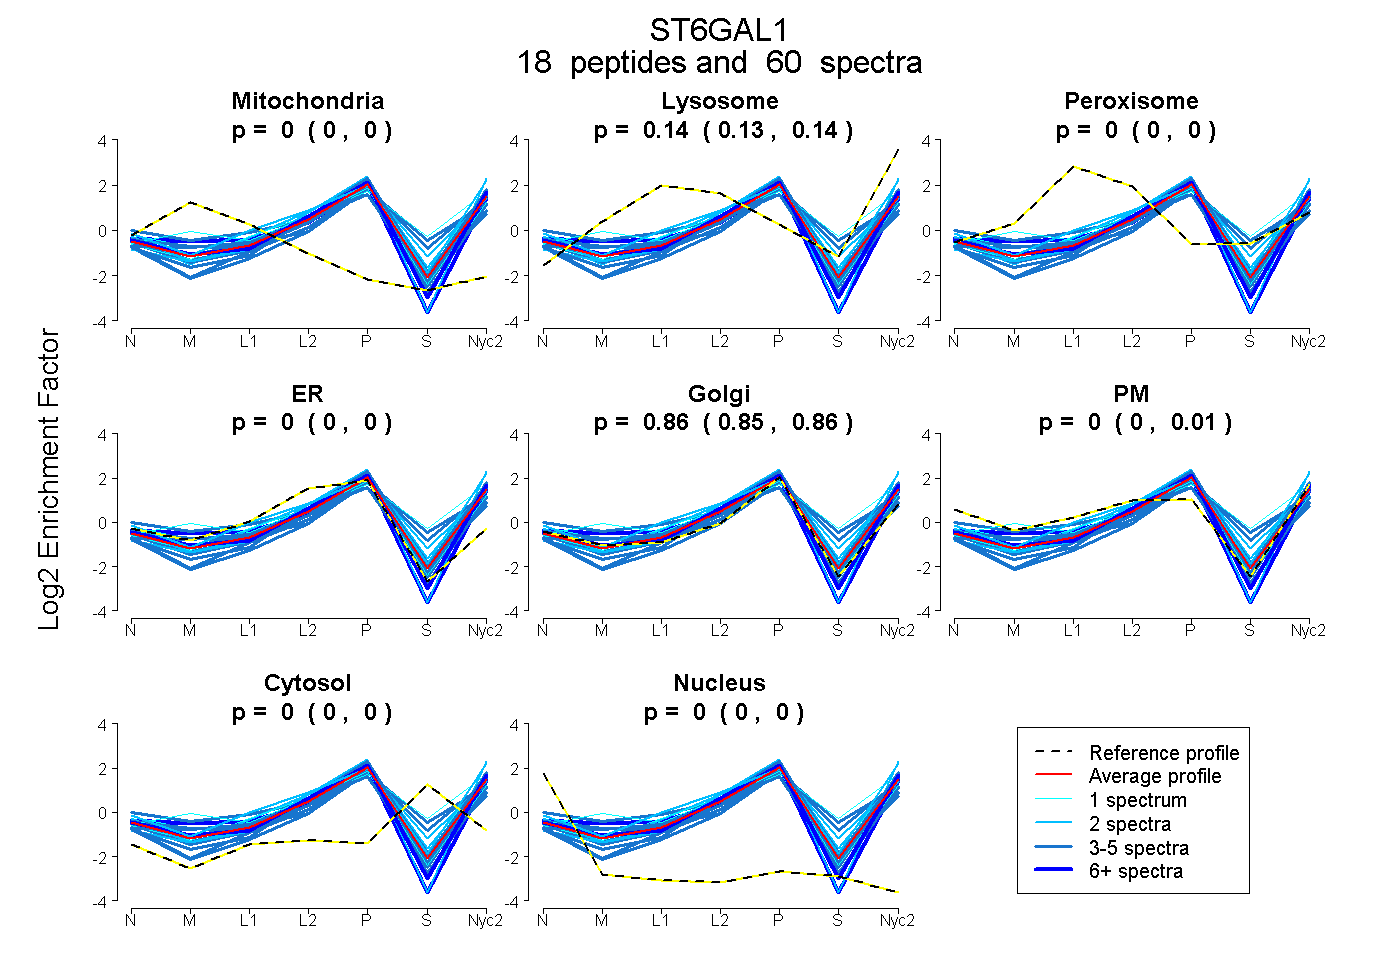 |
0.000
0.000 | 0.000 |
0.140
0.133 | 0.144 |
|
0.000
0.000 | 0.000 |
0.000
0.000 | 0.000 |
0.858
0.850 | 0.862 |
0.001
0.000 | 0.012 |
0.000
0.000 | 0.000 |
0.000
0.000 | 0.000 |
|
| | | Plot |
Mito |
|
Lyso or Perox |
|
ER |
Golgi |
PM |
Cytosol |
Nucleus |
|
| Expt B |
4
peptides |
11
spectra |
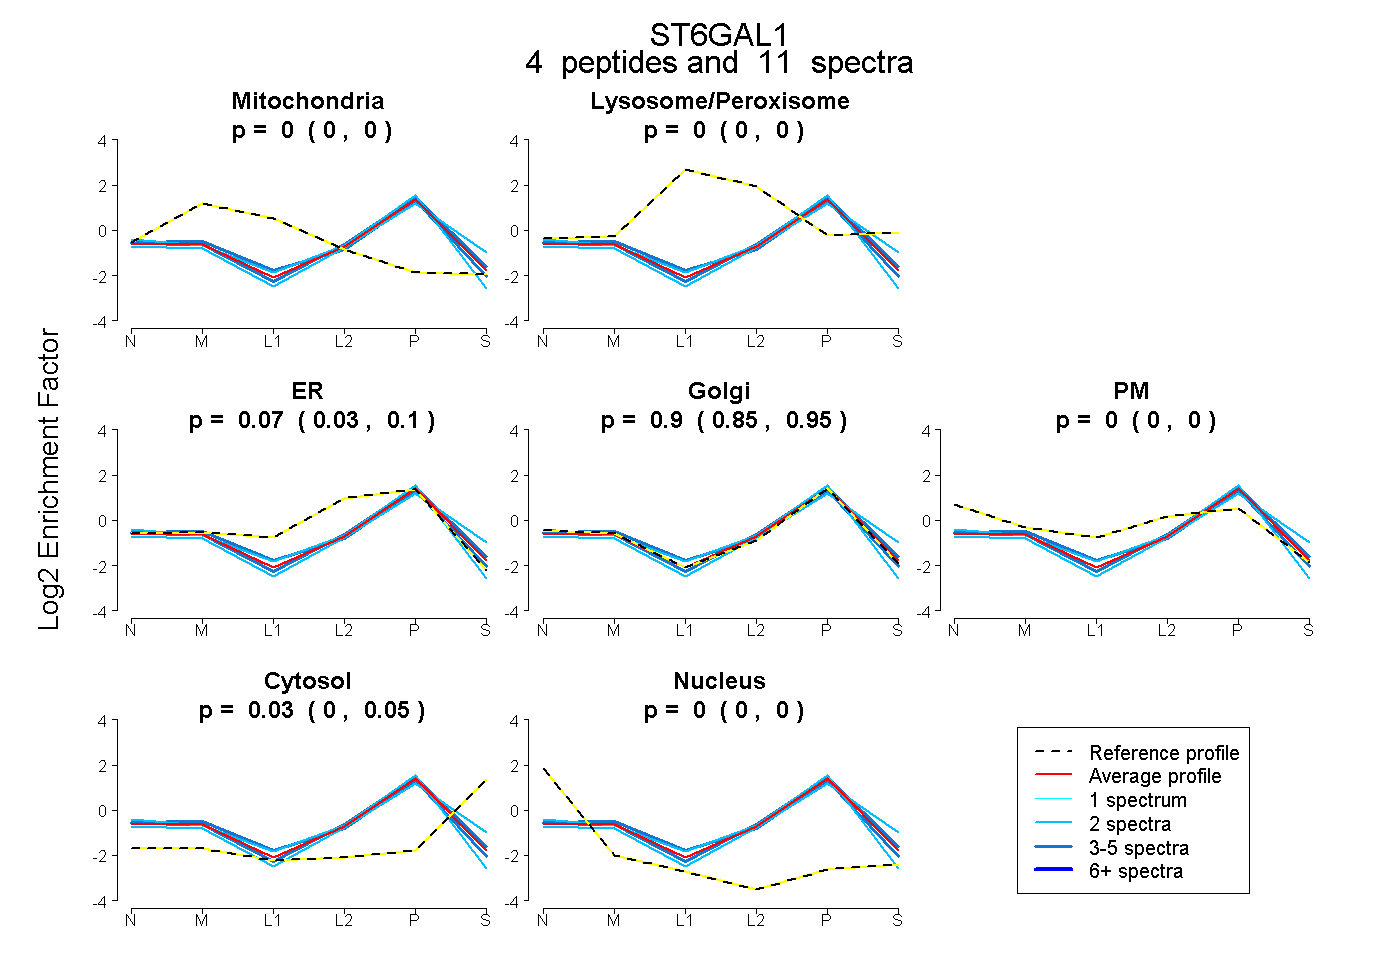 |
0.000
0.000 | 0.000 |
|
0.000
0.000 | 0.002 |
|
0.071
0.032 | 0.098 |
0.901
0.852 | 0.946 |
0.000
0.000 | 0.000 |
0.028
0.000 | 0.053 |
0.000
0.000 | 0.000 |
|
| 4 spectra, EIDNHDAVLR |
0.000 |
|
0.000 |
|
0.062 |
0.895 |
0.000 |
0.043 |
0.000 |
|
| 2 spectra, VGPWQR |
0.000 |
|
0.000 |
|
0.002 |
0.828 |
0.000 |
0.170 |
0.000 |
|
| 2 spectra, FSVEALR |
0.000 |
|
0.000 |
|
0.171 |
0.820 |
0.000 |
0.000 |
0.009 |
|
| 3 spectra, ATLSGFR |
0.045 |
|
0.000 |
|
0.079 |
0.876 |
0.000 |
0.000 |
0.000 |
|
| | | Plot |
|
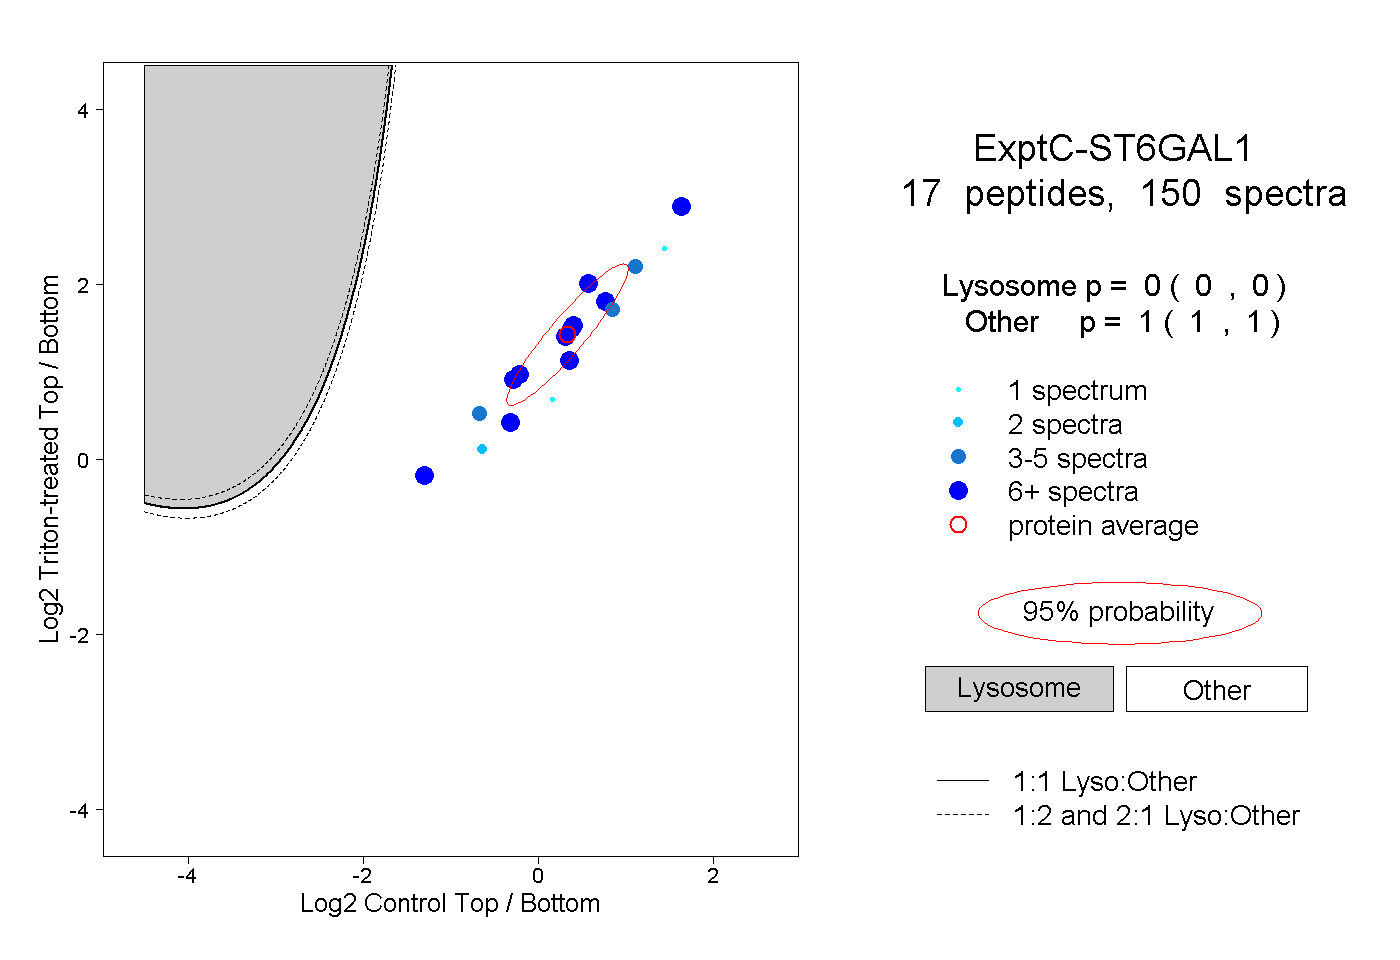
Lyso |
|
|
|
|
|
|
|
Other |
| Expt C |
17
peptides |
150
spectra |
 |
|
0.000
0.000 | 0.000 |
|
|
|
|
|
|
|
1.000
1.000 | 1.000 |
| | | Plot |
|
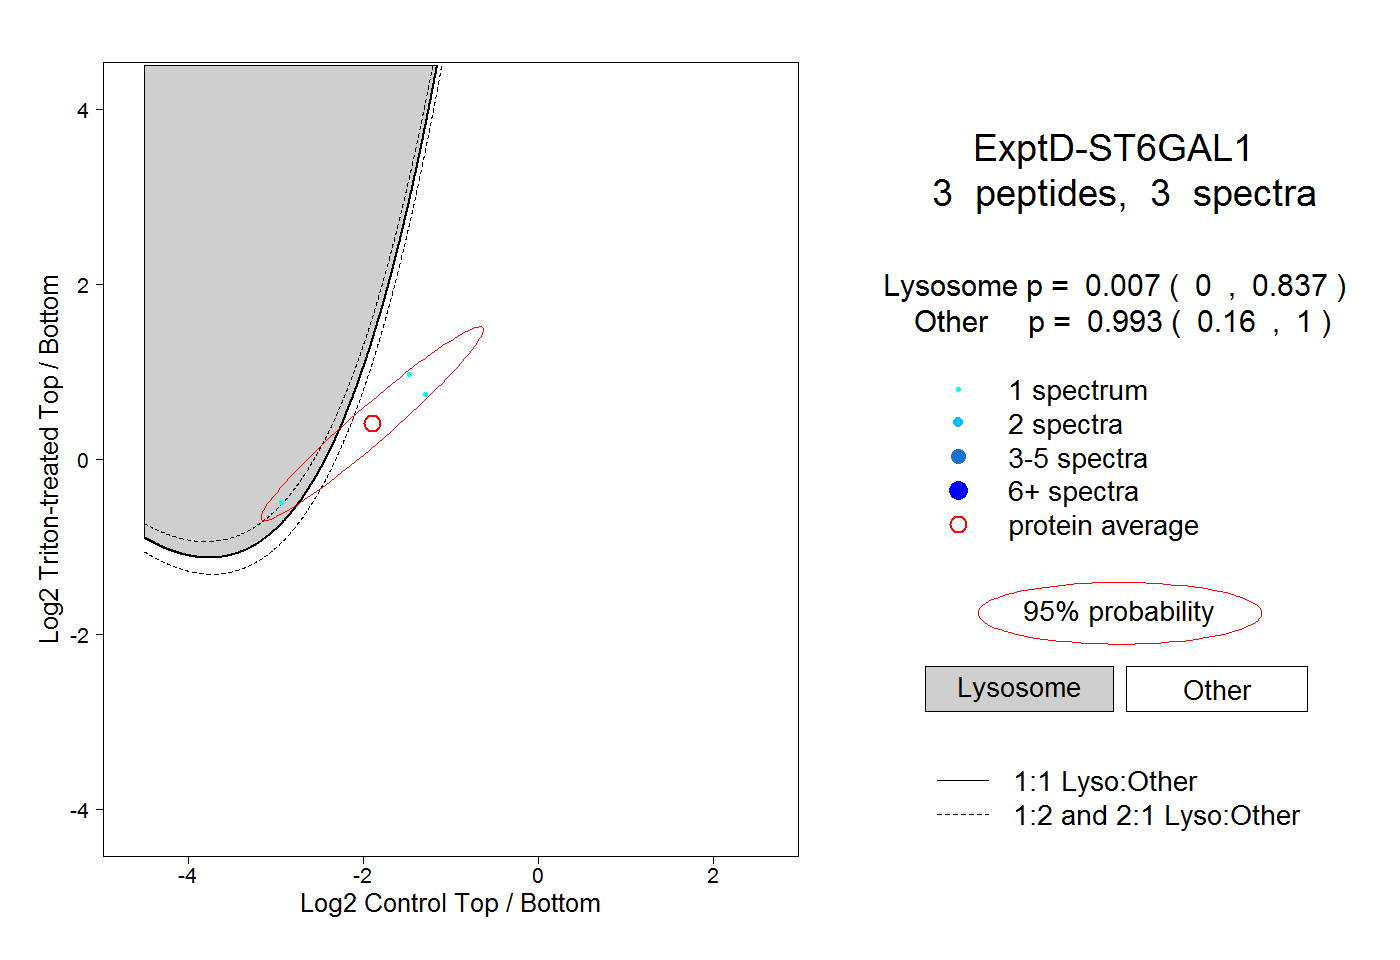
Lyso |
|
|
|
|
|
|
|
Other |
| Expt D |
3
peptides |
3
spectra |
 |
|
0.007
0.000 | 0.837 |
|
|
|
|
|
|
|
0.993
0.160 | 1.000 |