 7
7peptides
spectra
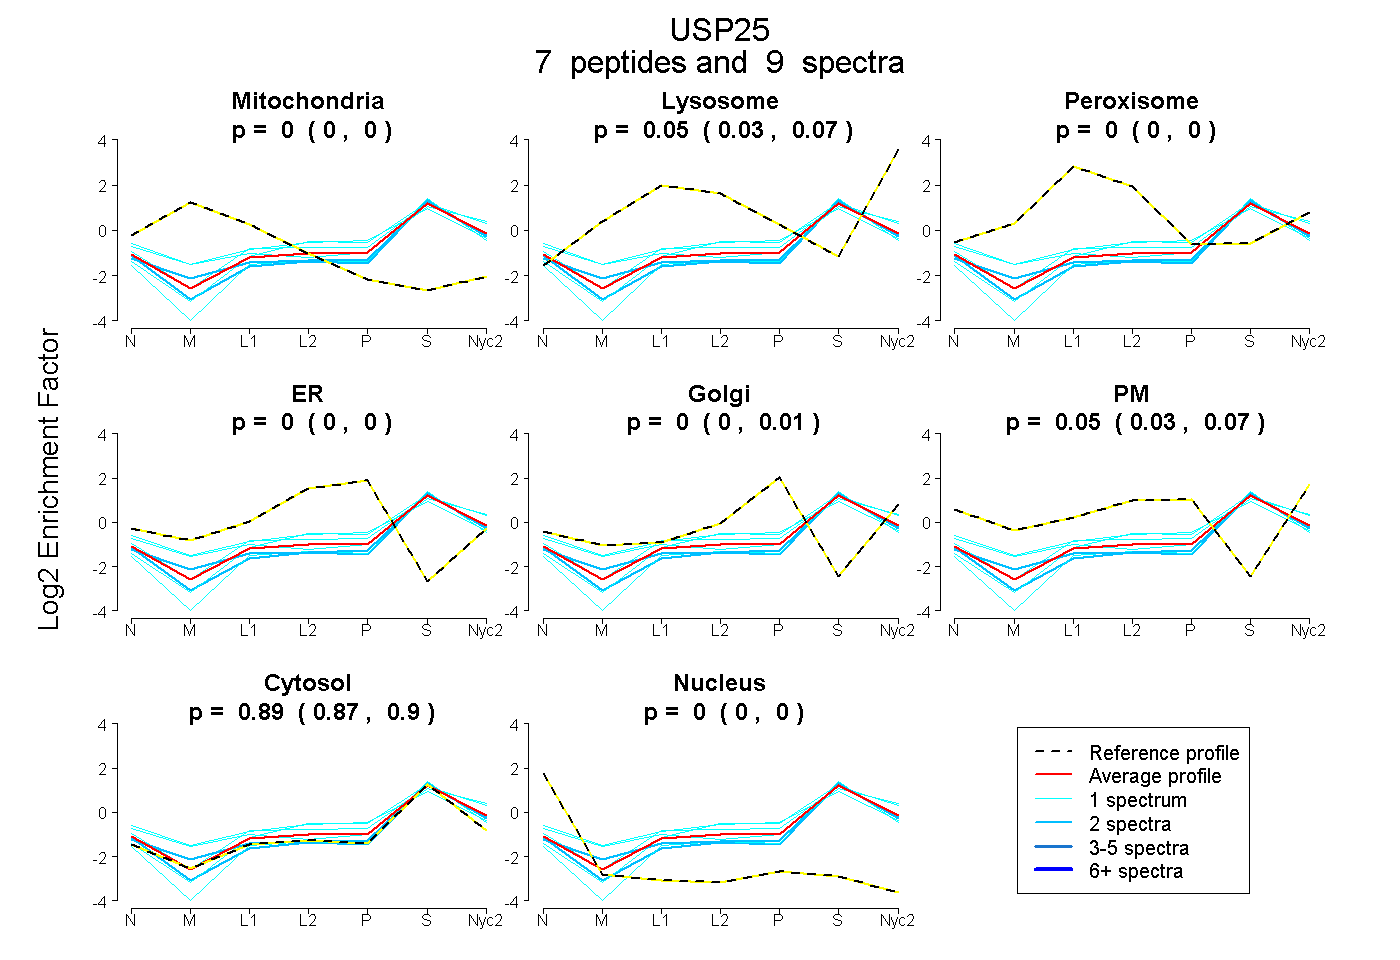
0.000 | 0.000
0.029 | 0.074
0.000 | 0.000
0.000 | 0.000
0.000 | 0.014
0.026 | 0.074
0.874 | 0.904
0.000 | 0.000
2peptides
spectra
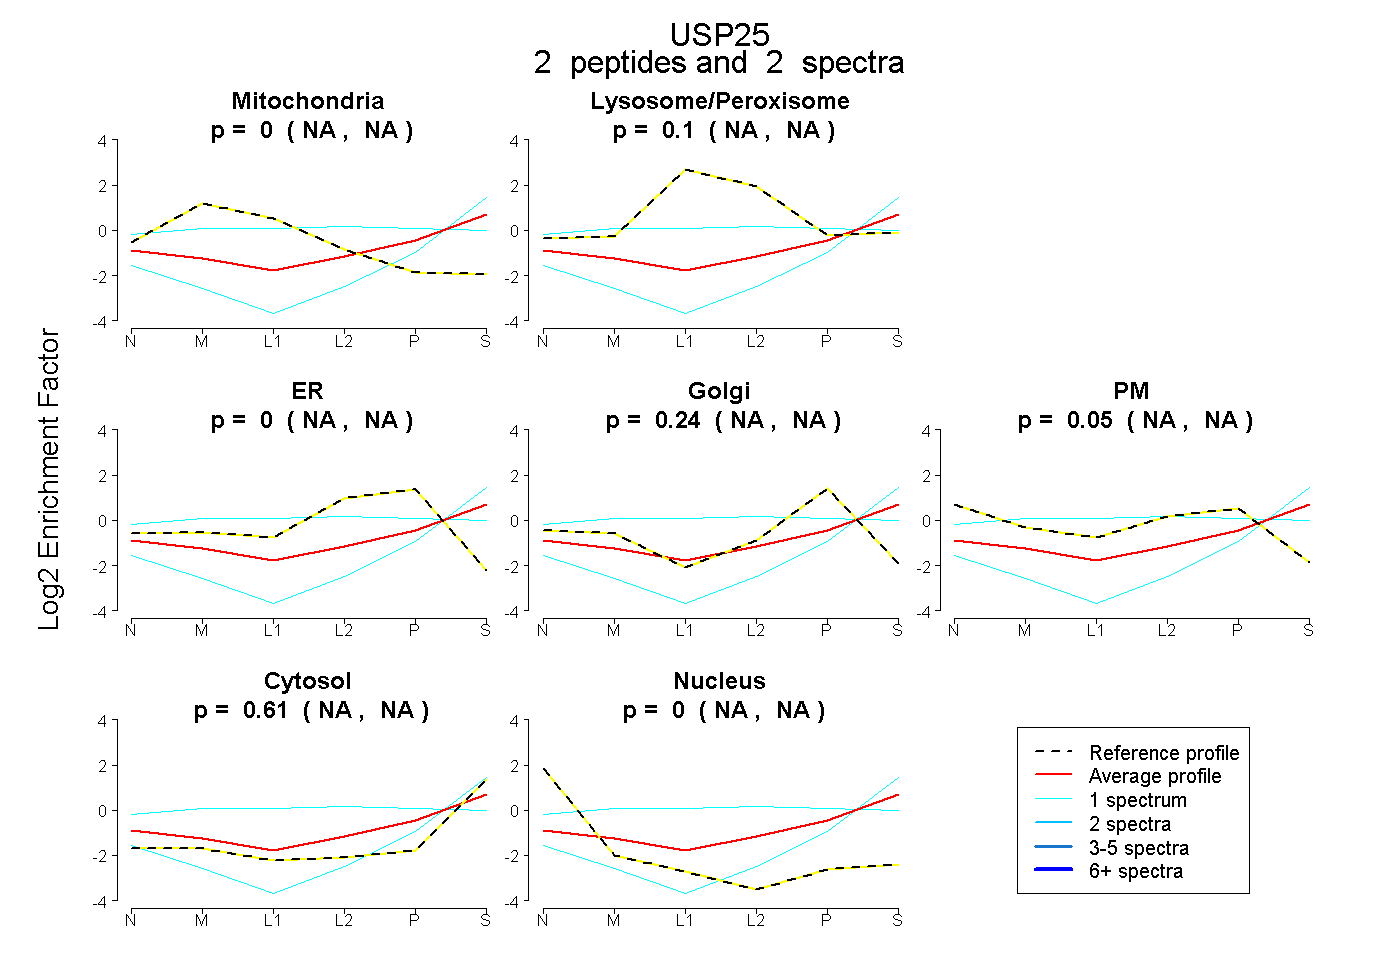
NA | NA
NA | NA
NA | NA
NA | NA
NA | NA
NA | NA
NA | NA
2peptides
spectra
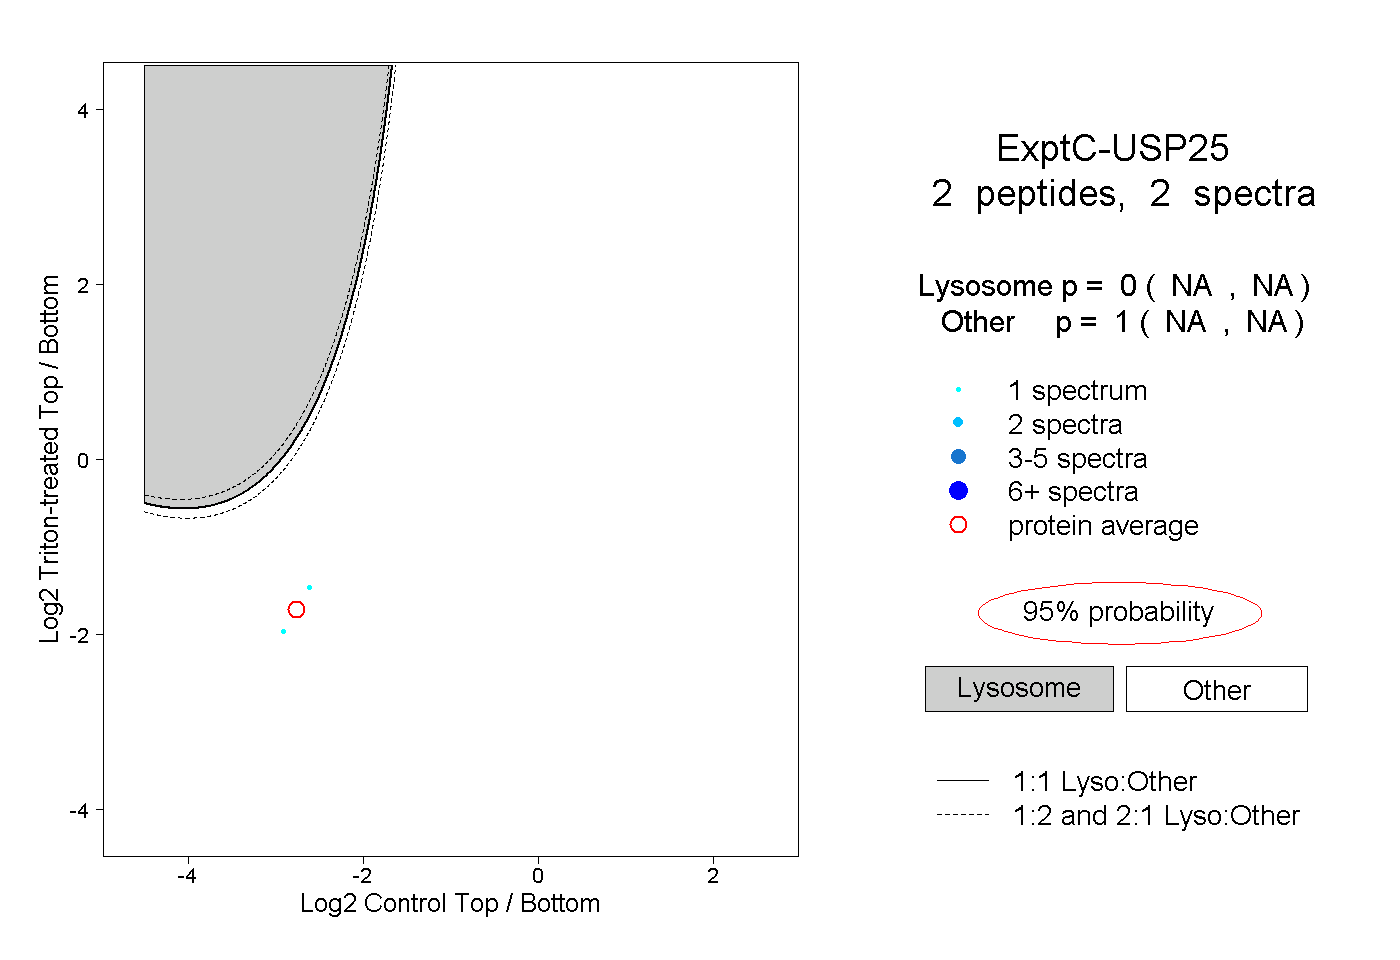
NA | NA
NA | NA