 10
10peptides
spectra
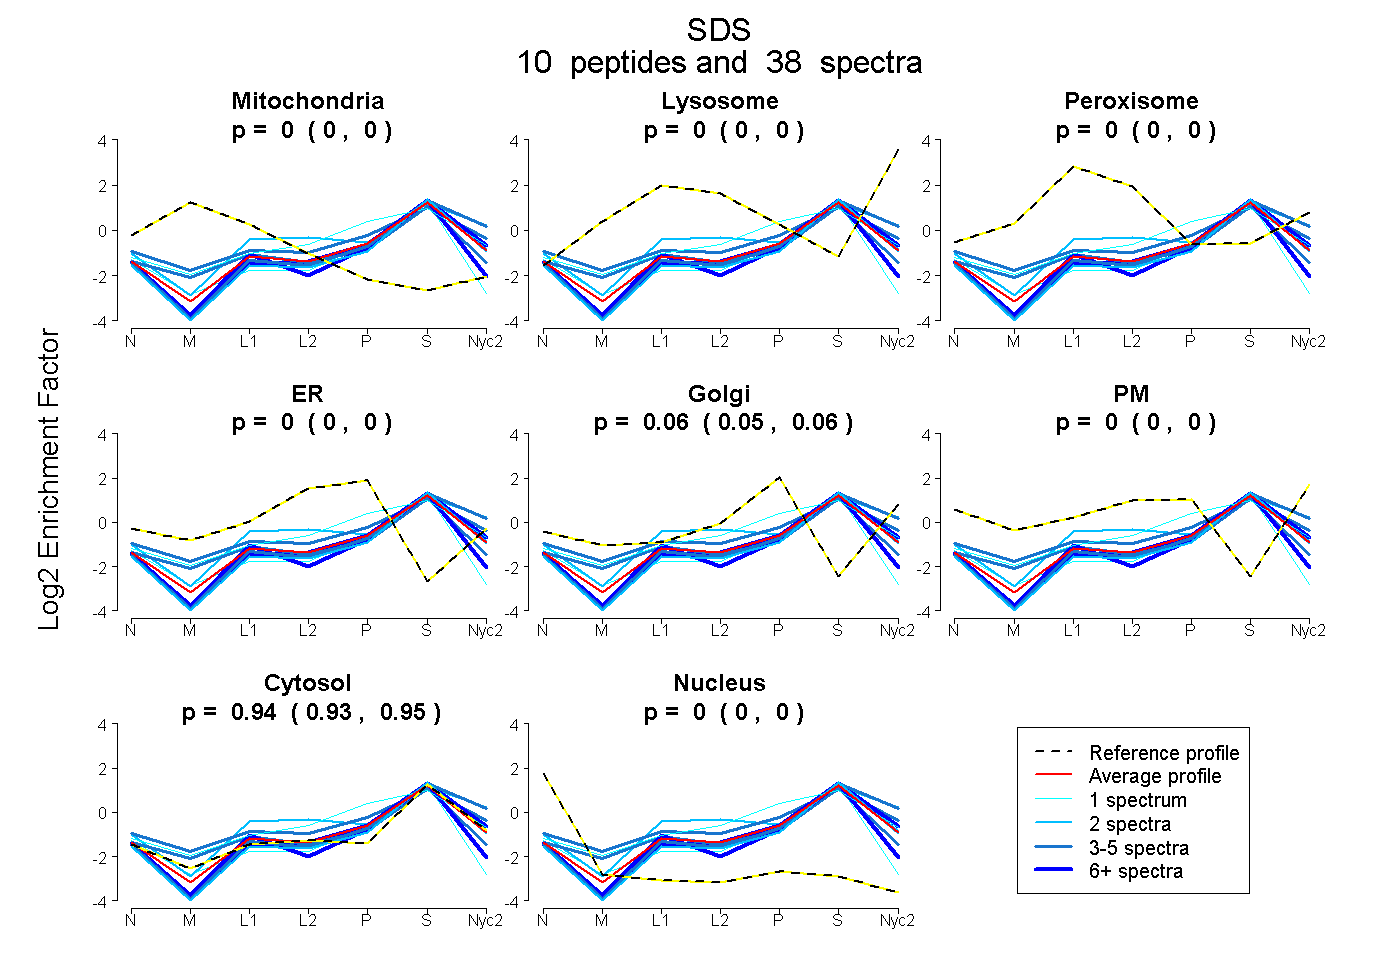
0.000 | 0.000
0.000 | 0.000
0.000 | 0.000
0.000 | 0.000
0.050 | 0.064
0.000 | 0.000
0.934 | 0.948
0.000 | 0.000
2peptides
spectra
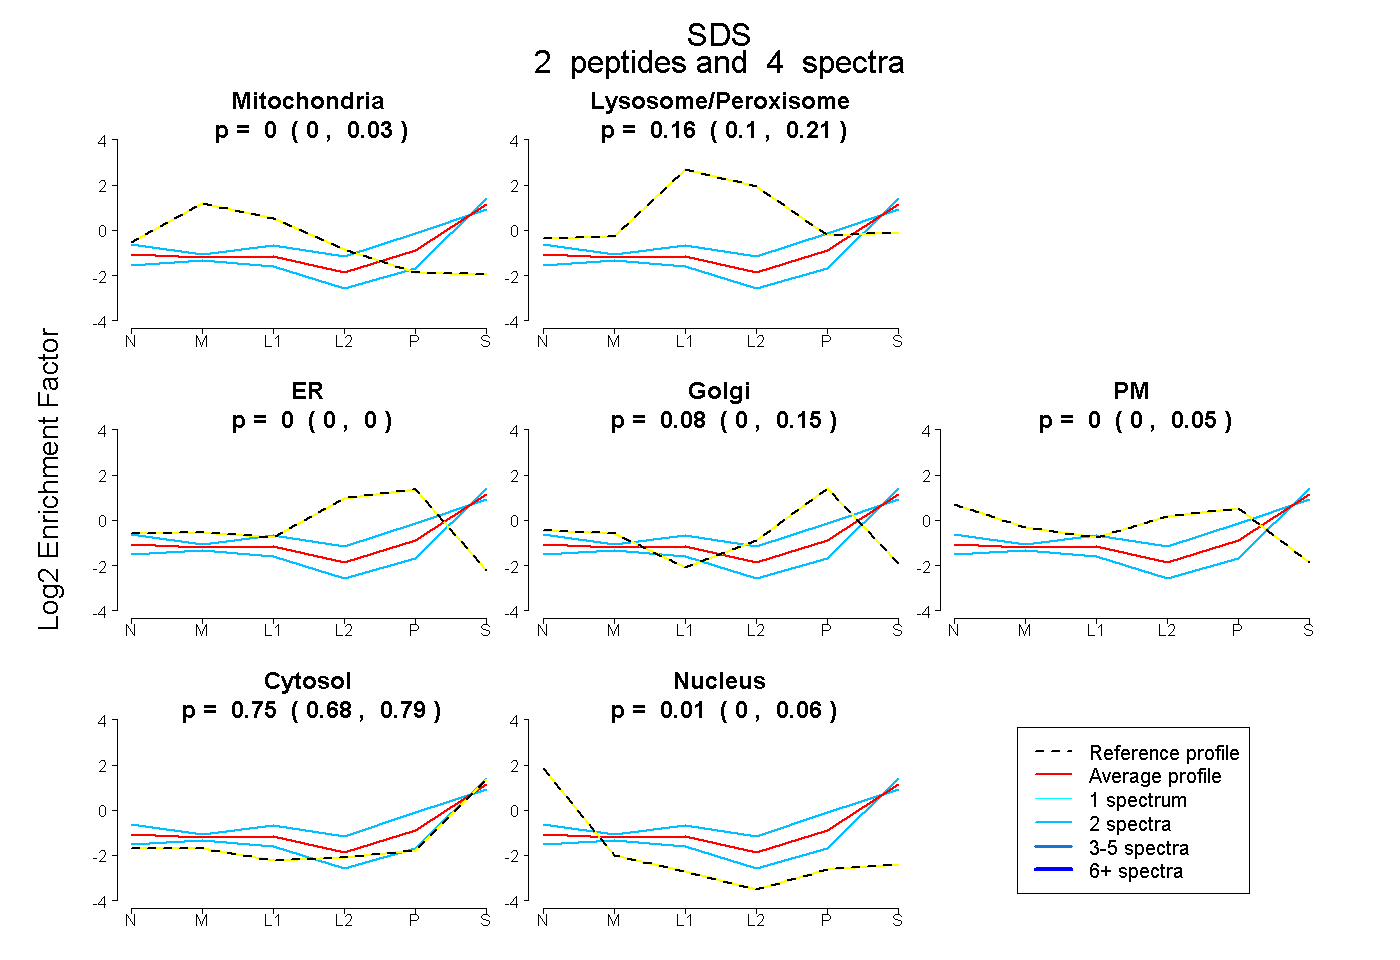
0.000 | 0.035
0.096 | 0.206
0.000 | 0.000
0.000 | 0.155
0.000 | 0.054
0.683 | 0.791
0.000 | 0.059
11peptides
spectra
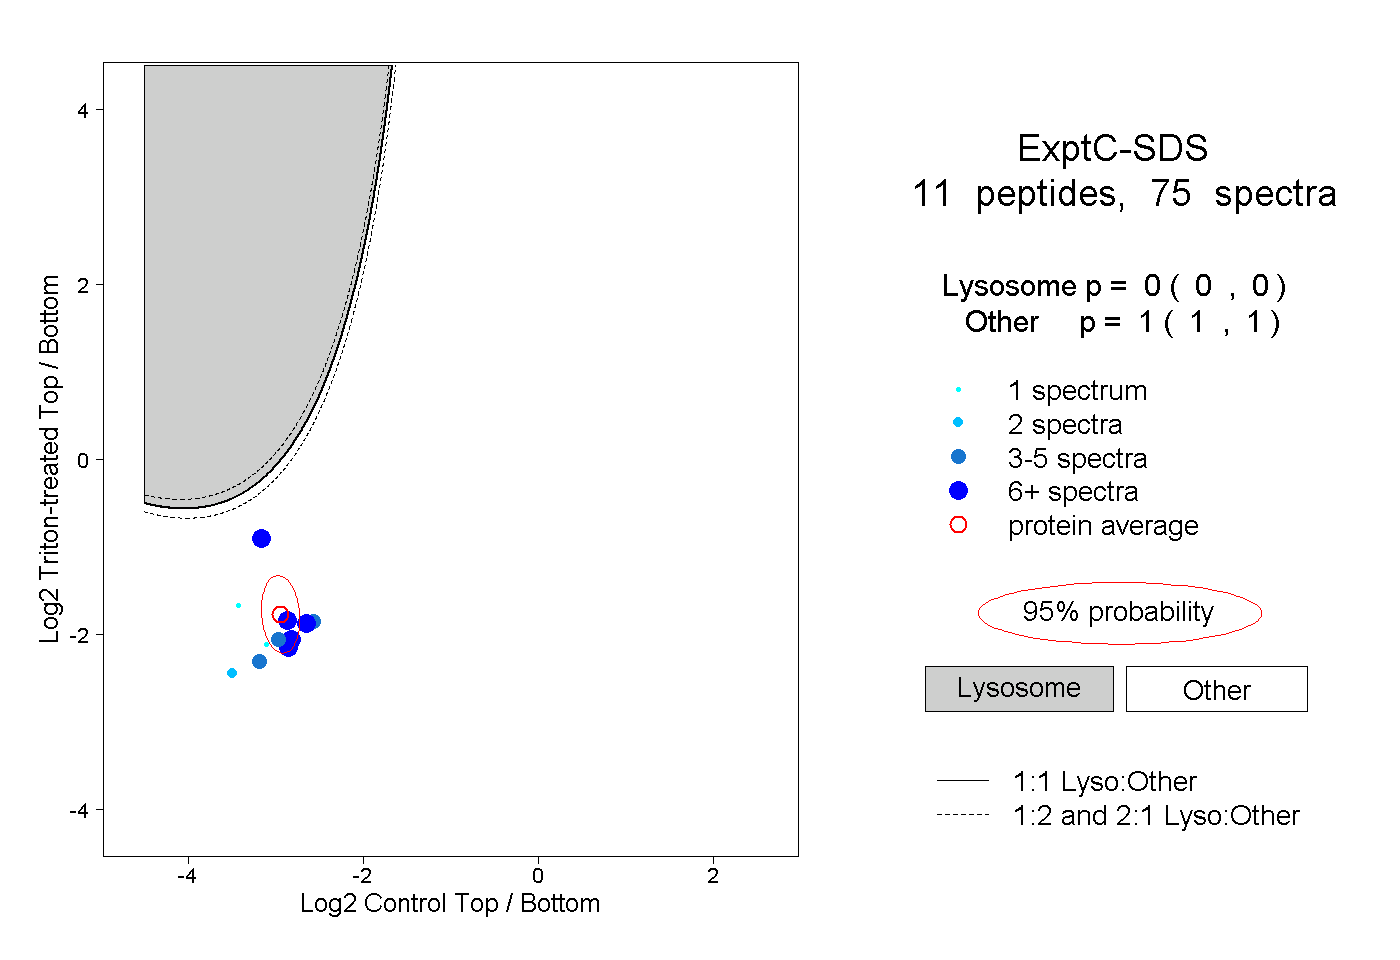
0.000 | 0.000
1.000 | 1.000
5peptides
spectra
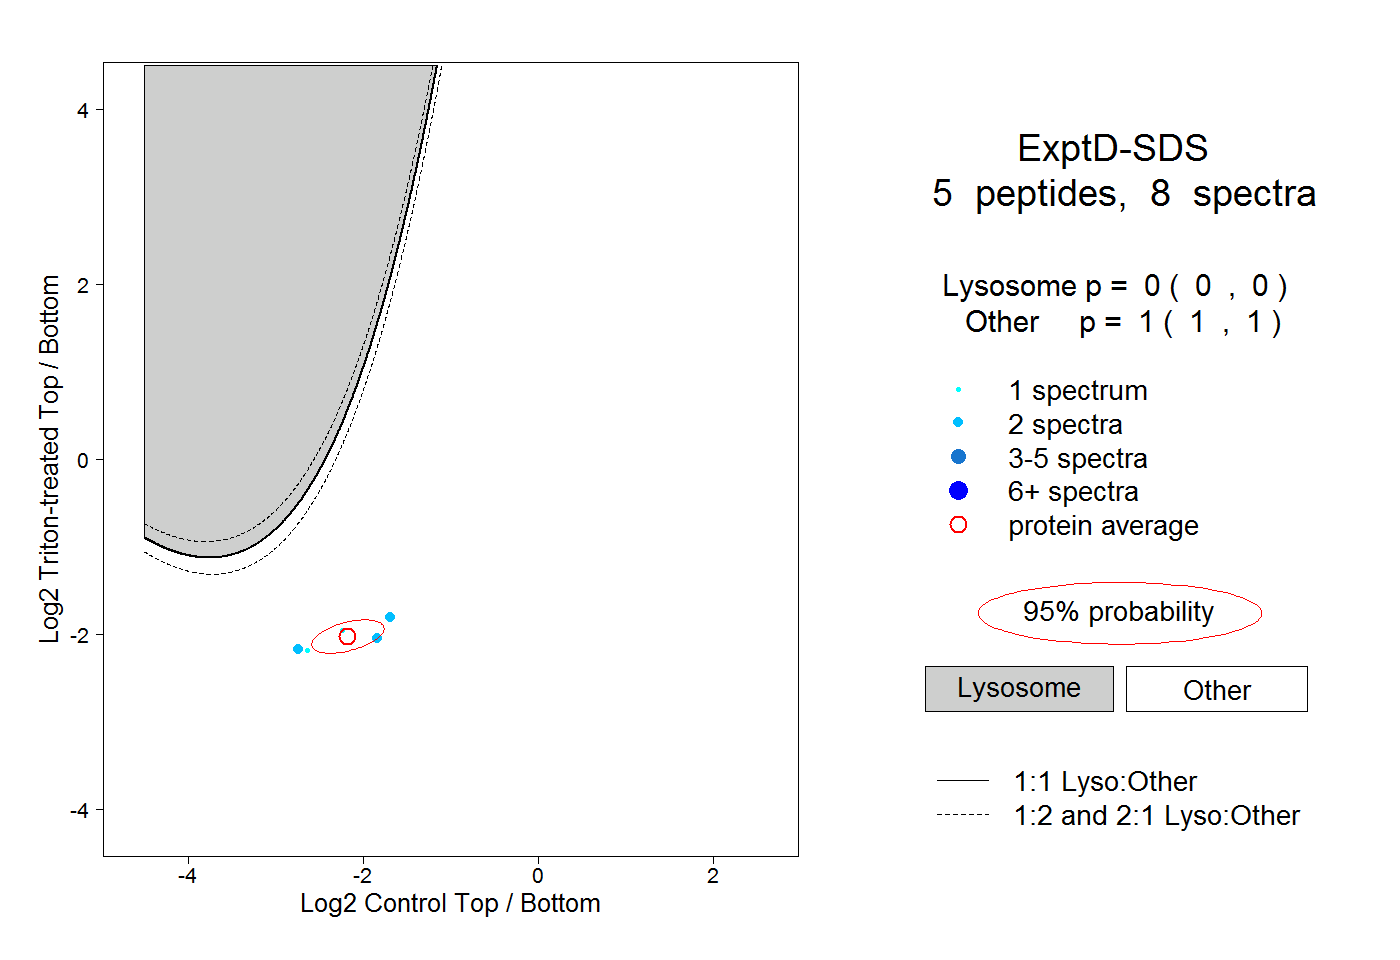
0.000 | 0.000
1.000 | 1.000