 10
10peptides
spectra
0.000 | 0.000
0.000 | 0.000
0.000 | 0.000
0.000 | 0.000
0.050 | 0.064
0.000 | 0.000
0.934 | 0.948
0.000 | 0.000
| Plot | Mito | Lyso | Perox | ER | Golgi | PM | Cytosol | Nucleus | |||||
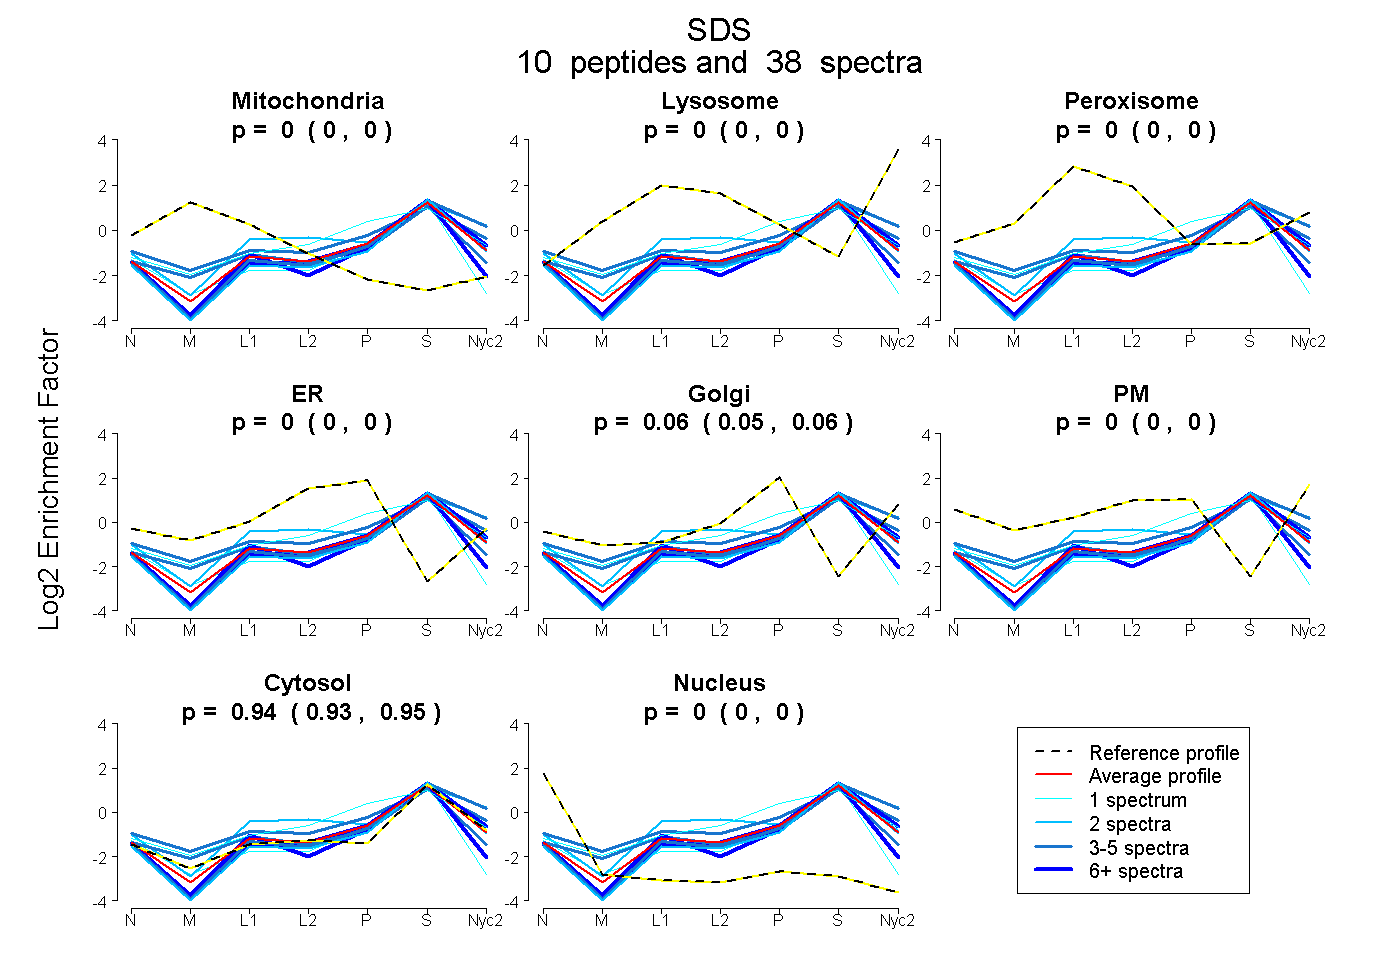
| Expt A |
10 peptides |
38 spectra |
|
0.000 0.000 | 0.000 |
0.000 0.000 | 0.000 |
0.000 0.000 | 0.000 |
0.000 0.000 | 0.000 |
0.058 0.050 | 0.064 |
0.000 0.000 | 0.000 |
0.942 0.934 | 0.948 |
0.000 0.000 | 0.000 |
| 4 spectra, DSMALSK | 0.000 | 0.000 | 0.091 | 0.000 | 0.176 | 0.000 | 0.733 | 0.000 | ||
| 2 spectra, MDSSQPSGSFK | 0.000 | 0.000 | 0.000 | 0.000 | 0.000 | 0.000 | 0.999 | 0.001 | ||
| 2 spectra, ALGVNTVGAQTLK | 0.000 | 0.000 | 0.000 | 0.000 | 0.000 | 0.000 | 1.000 | 0.000 | ||
| 5 spectra, LVTLPK | 0.000 | 0.000 | 0.000 | 0.000 | 0.039 | 0.000 | 0.961 | 0.000 | ||
| 1 spectrum, VAGTSVFLK | 0.000 | 0.000 | 0.000 | 0.174 | 0.107 | 0.000 | 0.719 | 0.000 | ||
| 8 spectra, FVDDEK | 0.000 | 0.000 | 0.000 | 0.000 | 0.024 | 0.000 | 0.976 | 0.000 | ||
| 9 spectra, HFVCSSAGNAGMATAYAAR | 0.000 | 0.000 | 0.000 | 0.000 | 0.000 | 0.000 | 0.921 | 0.079 | ||
| 1 spectrum, AAQESLHVK | 0.000 | 0.000 | 0.000 | 0.000 | 0.000 | 0.000 | 0.849 | 0.151 | ||
| 2 spectra, AQLGLNELLK | 0.000 | 0.162 | 0.030 | 0.027 | 0.000 | 0.000 | 0.782 | 0.000 | ||
| 4 spectra, GIGHLCK | 0.070 | 0.000 | 0.000 | 0.037 | 0.000 | 0.000 | 0.893 | 0.000 |
| Plot | Mito | Lyso or Perox | ER | Golgi | PM | Cytosol | Nucleus | ||||||
| Expt B |
2 peptides |
4 spectra |
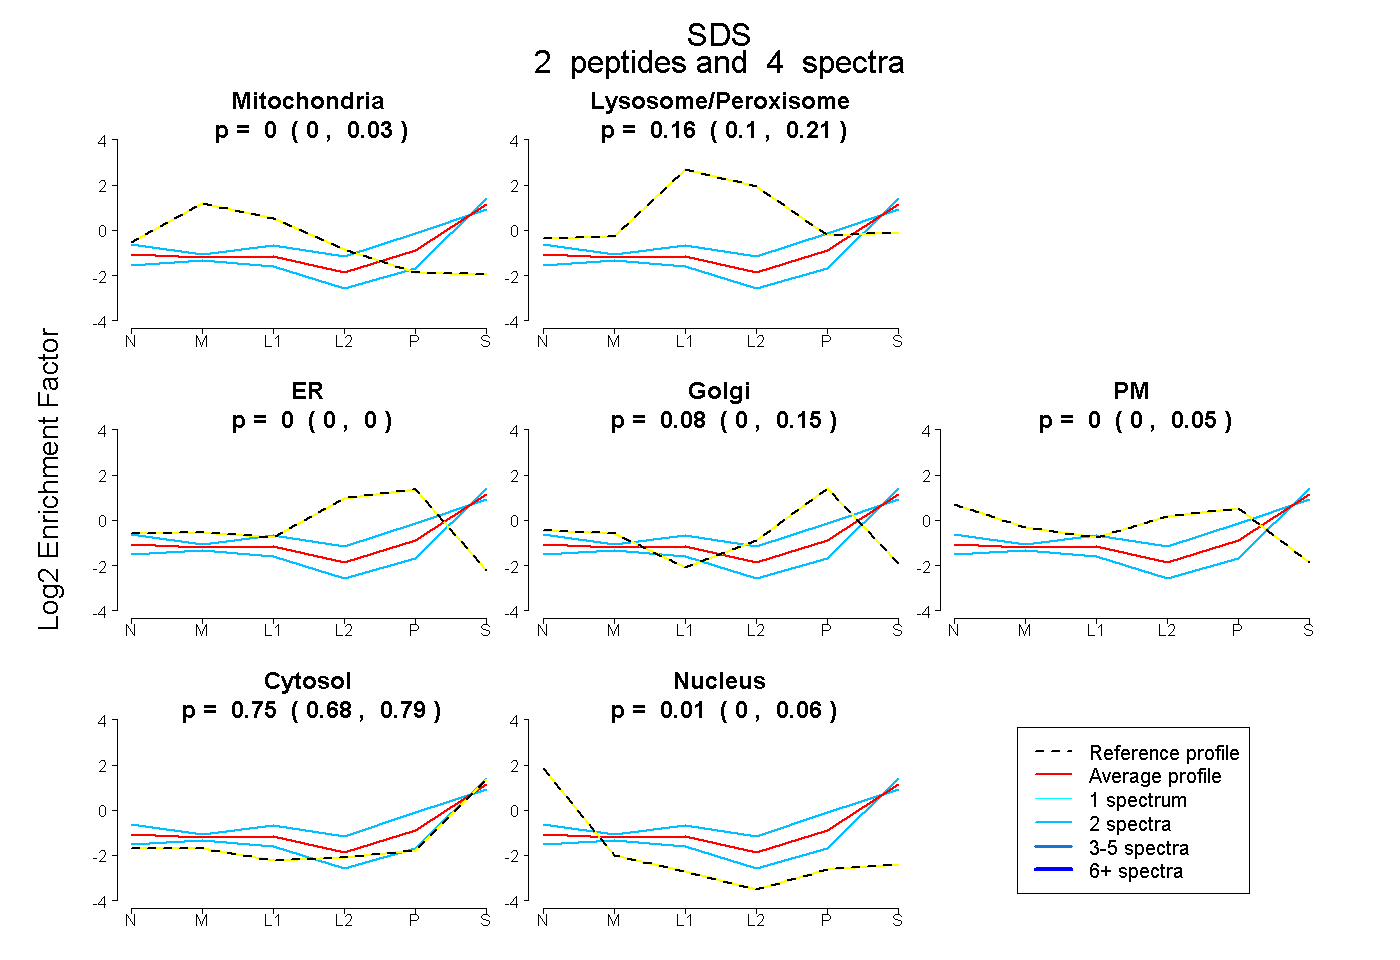 |
0.000 0.000 | 0.035 |
0.160 0.096 | 0.206 |
0.000 0.000 | 0.000 |
0.085 0.000 | 0.155 |
0.000 0.000 | 0.054 |
0.747 0.683 | 0.791 |
0.009 0.000 | 0.059 |
|||
| Plot | Lyso | Other | |||||||||||
| Expt C |
11 peptides |
75 spectra |
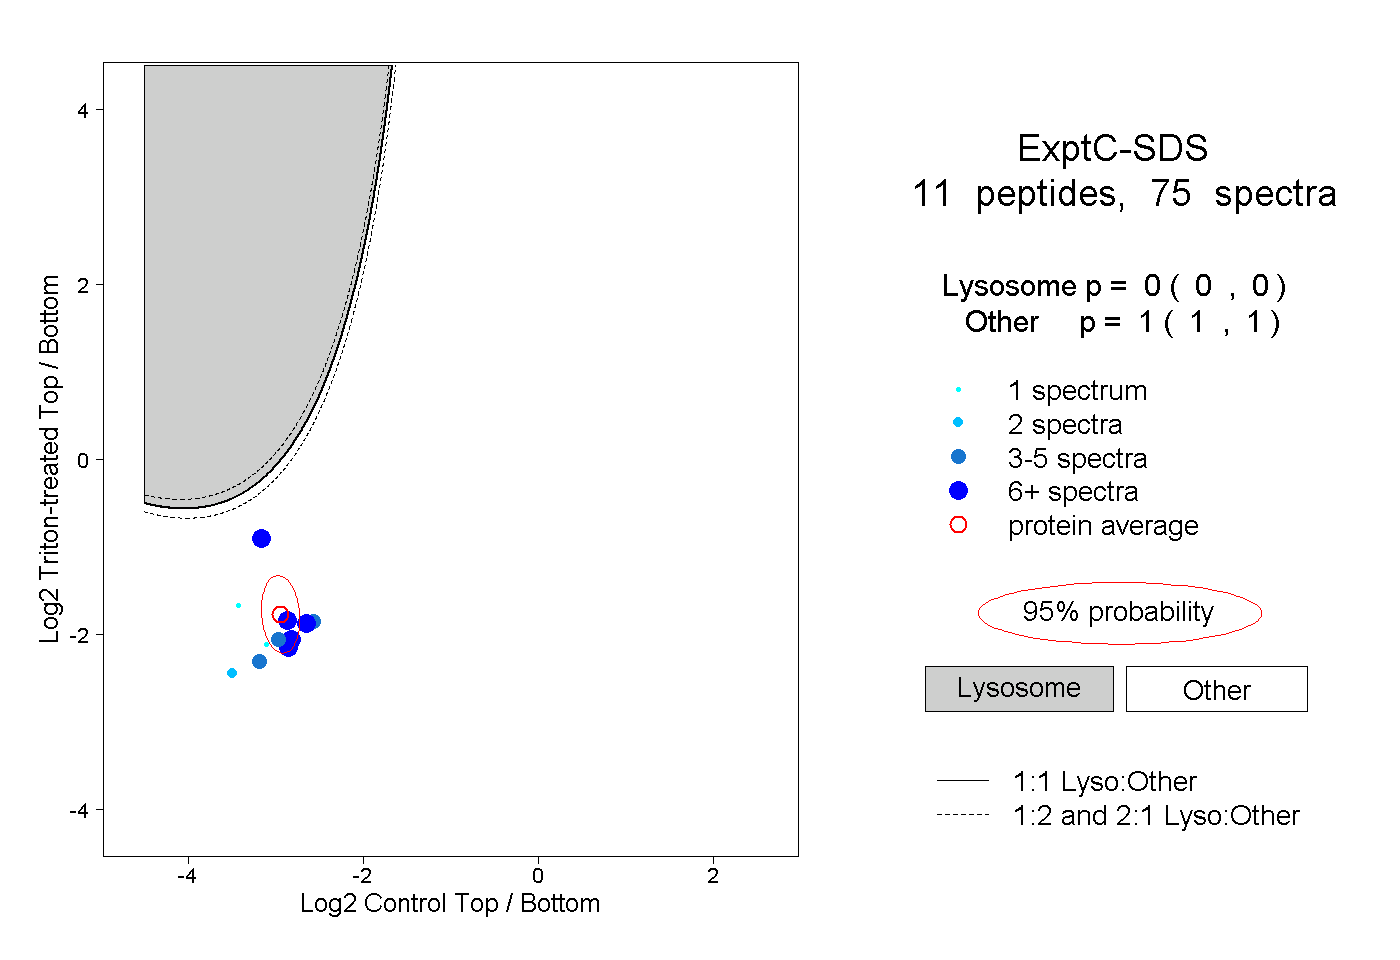 |
0.000 0.000 | 0.000 |
1.000 1.000 | 1.000 |
||||||||
| Plot | Lyso | Other | |||||||||||
| Expt D |
5 peptides |
8 spectra |
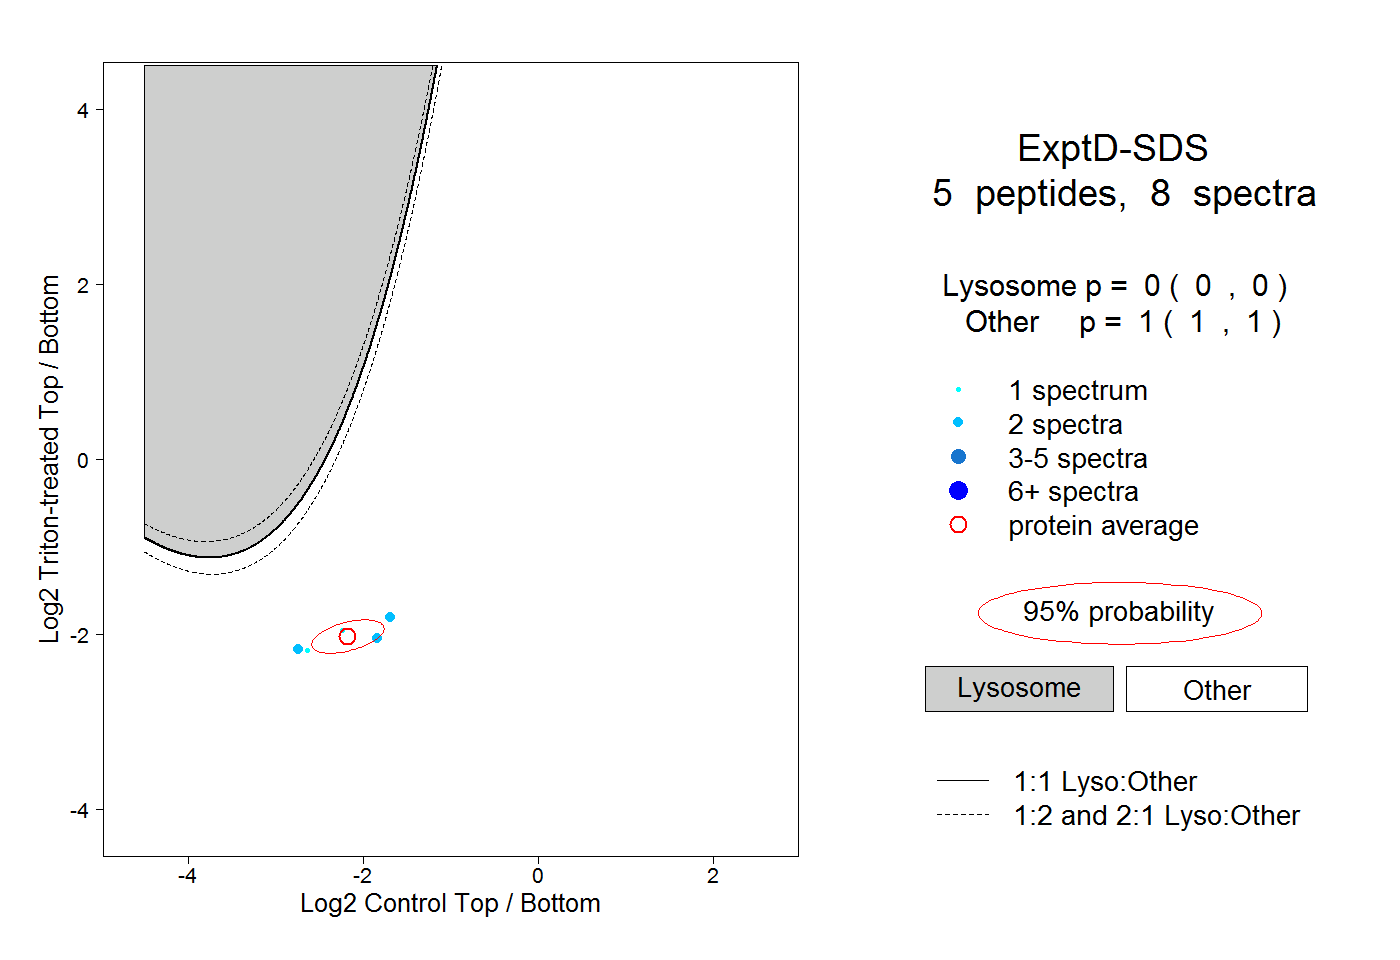 |
0.000 0.000 | 0.000 |
1.000 1.000 | 1.000 |