 21
21peptides
spectra
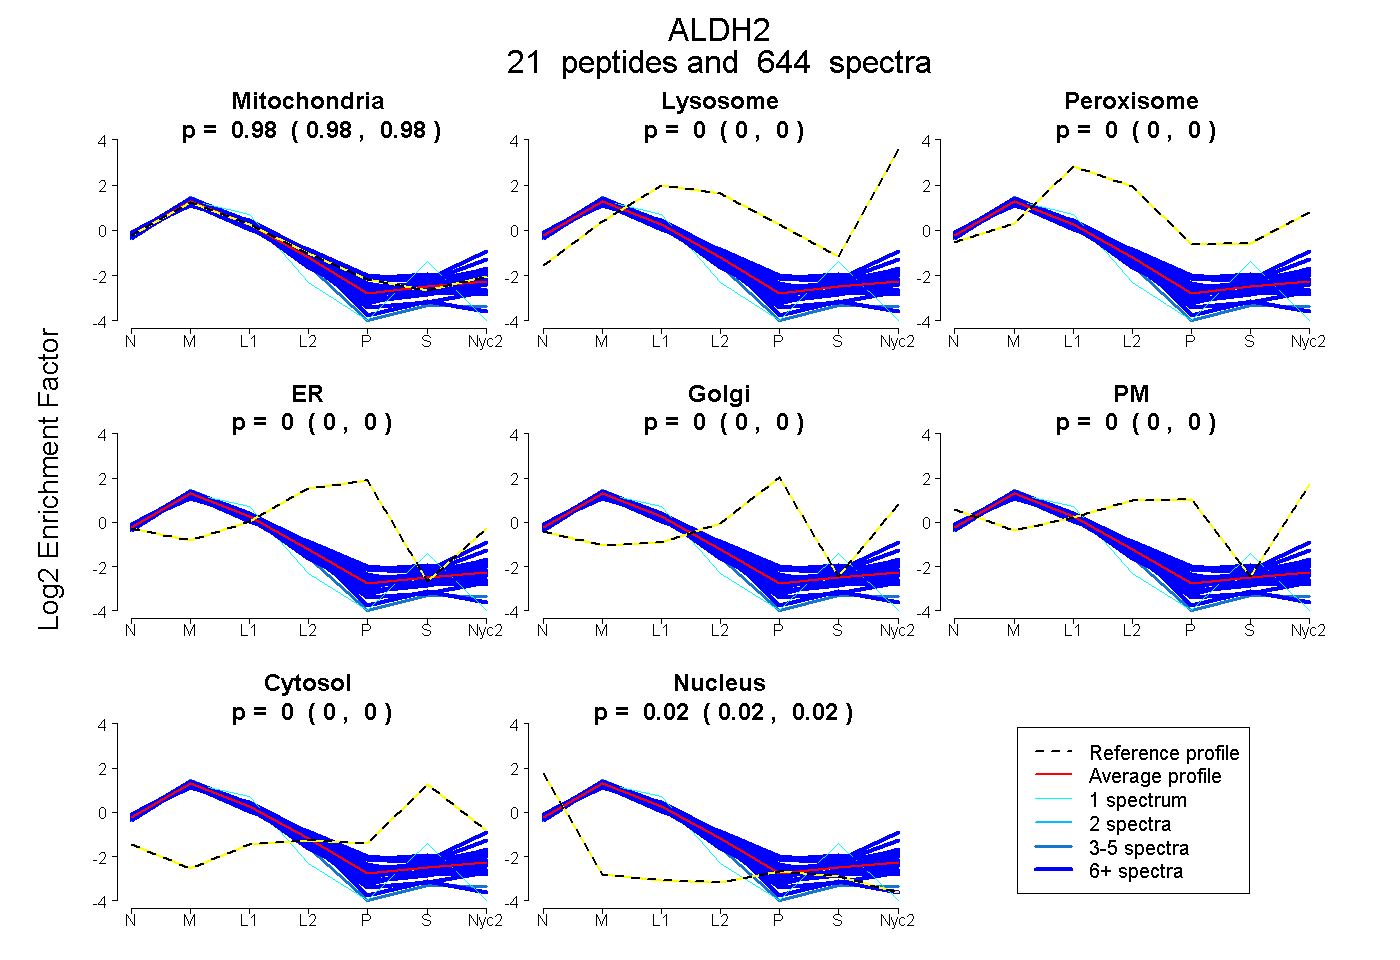
0.977 | 0.978
0.000 | 0.000
0.000 | 0.000
0.000 | 0.000
0.000 | 0.000
0.000 | 0.000
0.000 | 0.000
0.022 | 0.022
20peptides
spectra
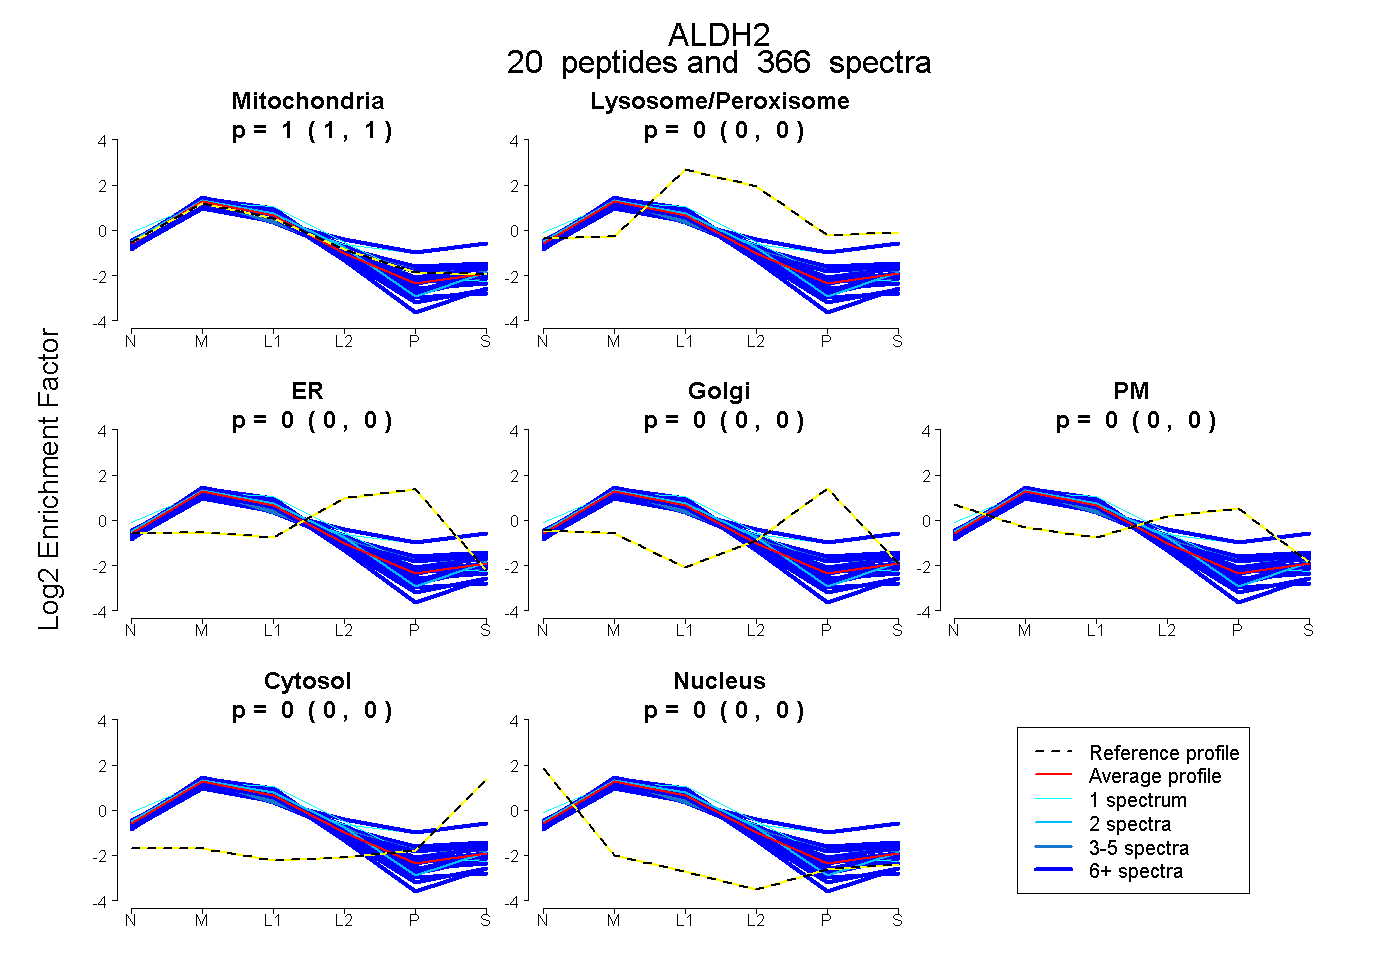
0.997 | 0.998
0.000 | 0.000
0.000 | 0.000
0.000 | 0.000
0.000 | 0.000
0.000 | 0.000
0.002 | 0.003
22peptides
spectra
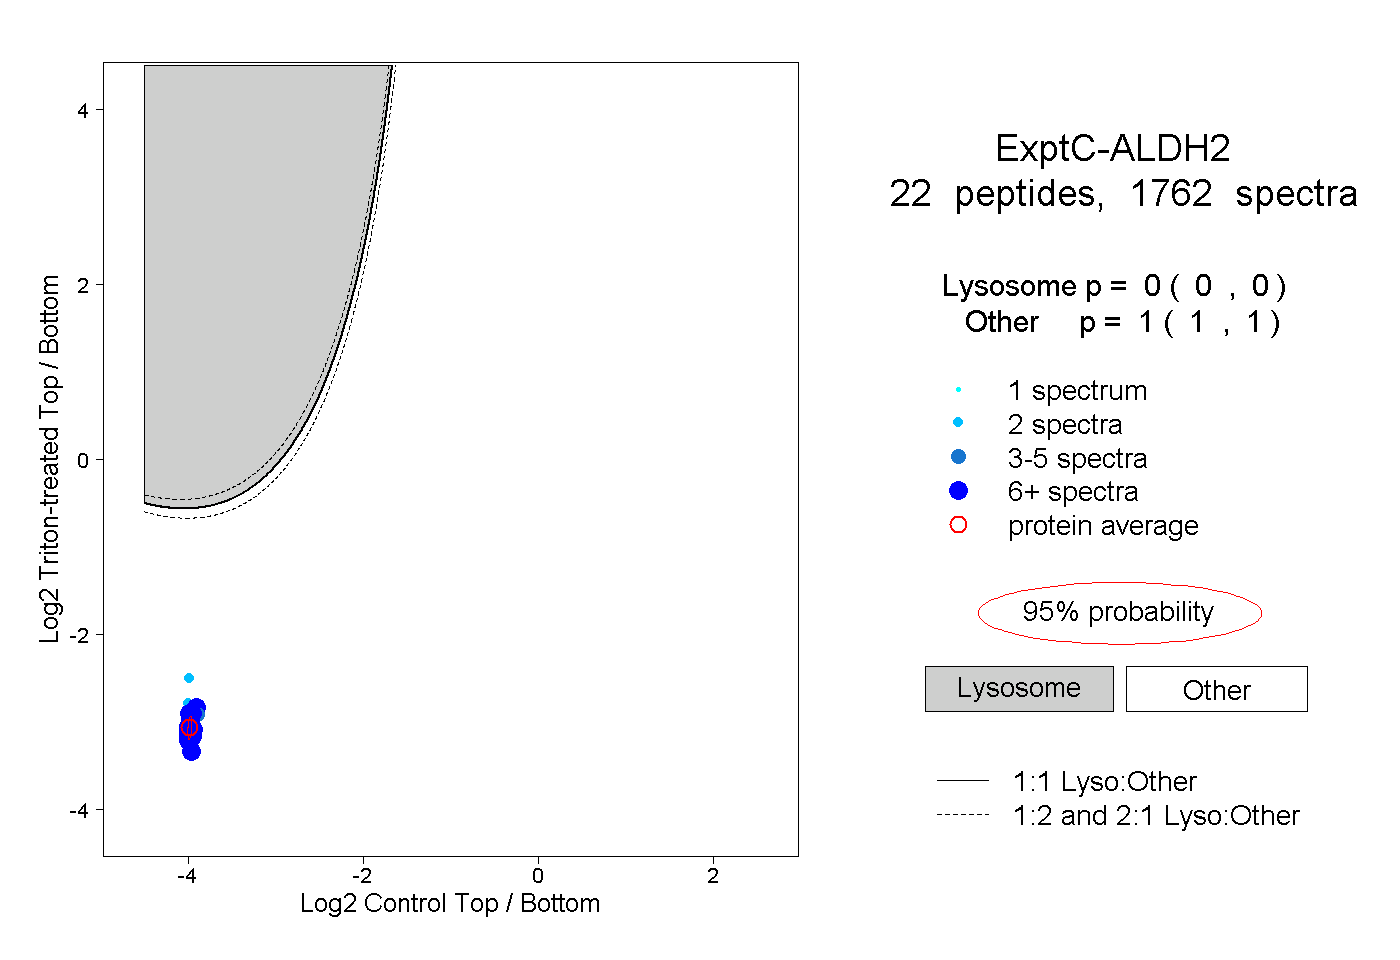
0.000 | 0.000
1.000 | 1.000
16peptides
spectra
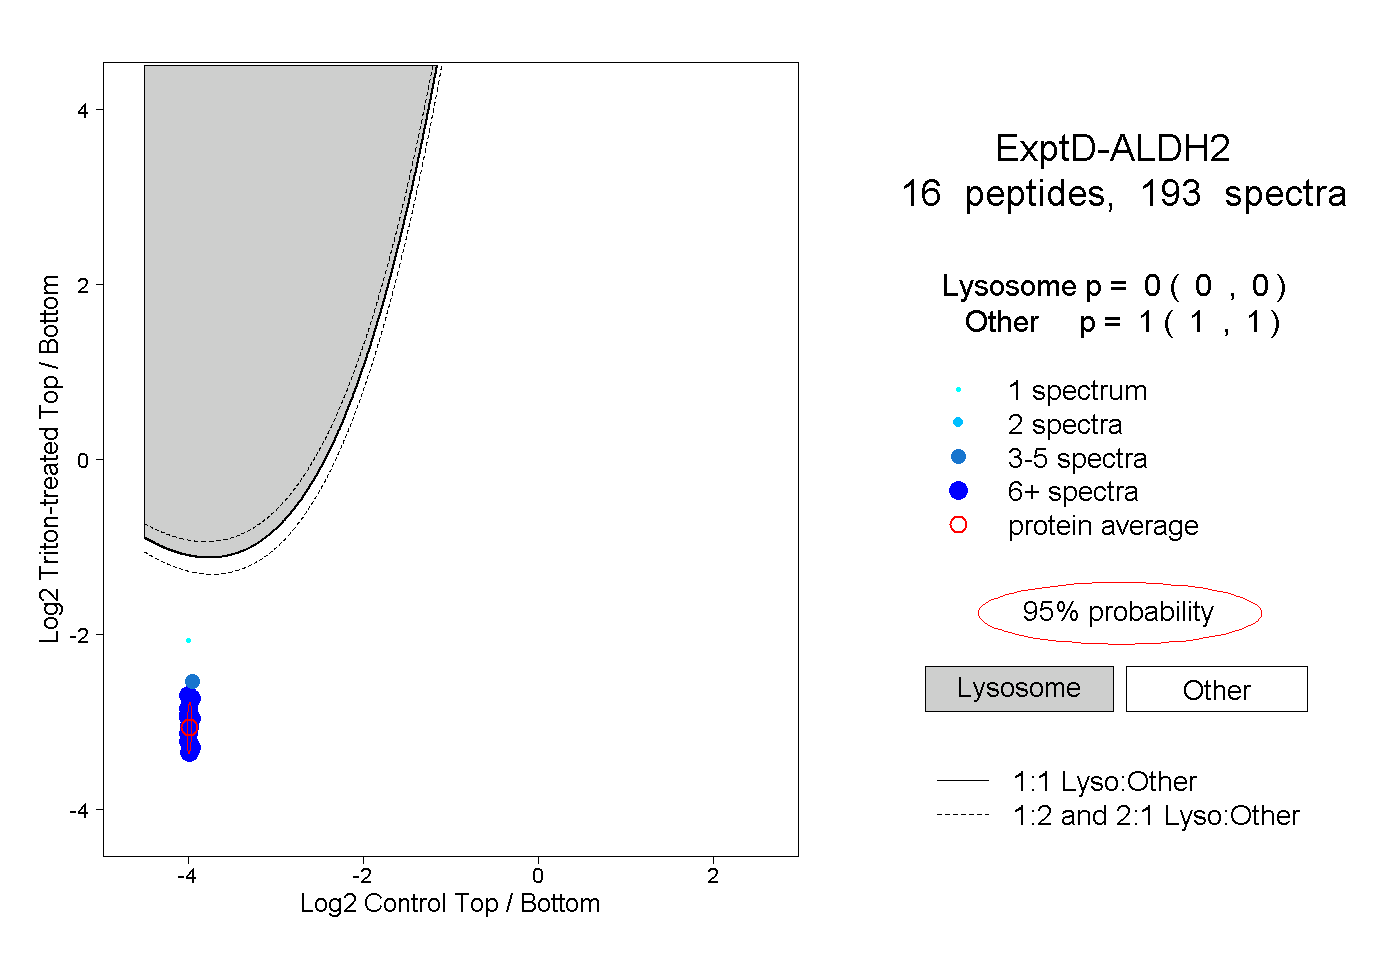
0.000 | 0.000
1.000 | 1.000