 19
19peptides
spectra
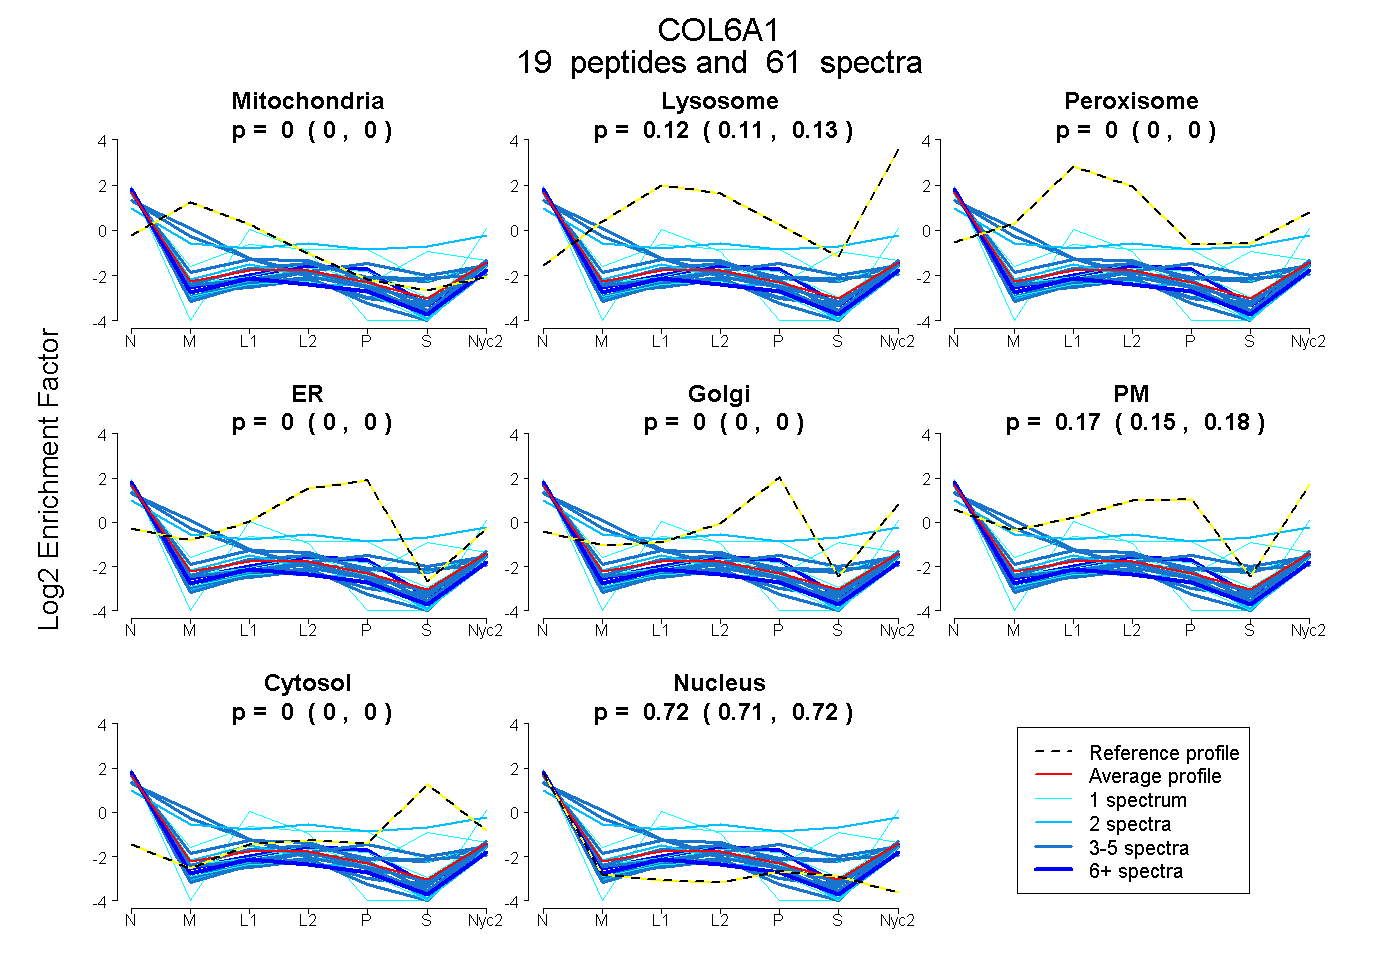
0.000 | 0.000
0.108 | 0.129
0.000 | 0.000
0.000 | 0.000
0.000 | 0.000
0.149 | 0.178
0.000 | 0.000
0.710 | 0.719
5peptides
spectra
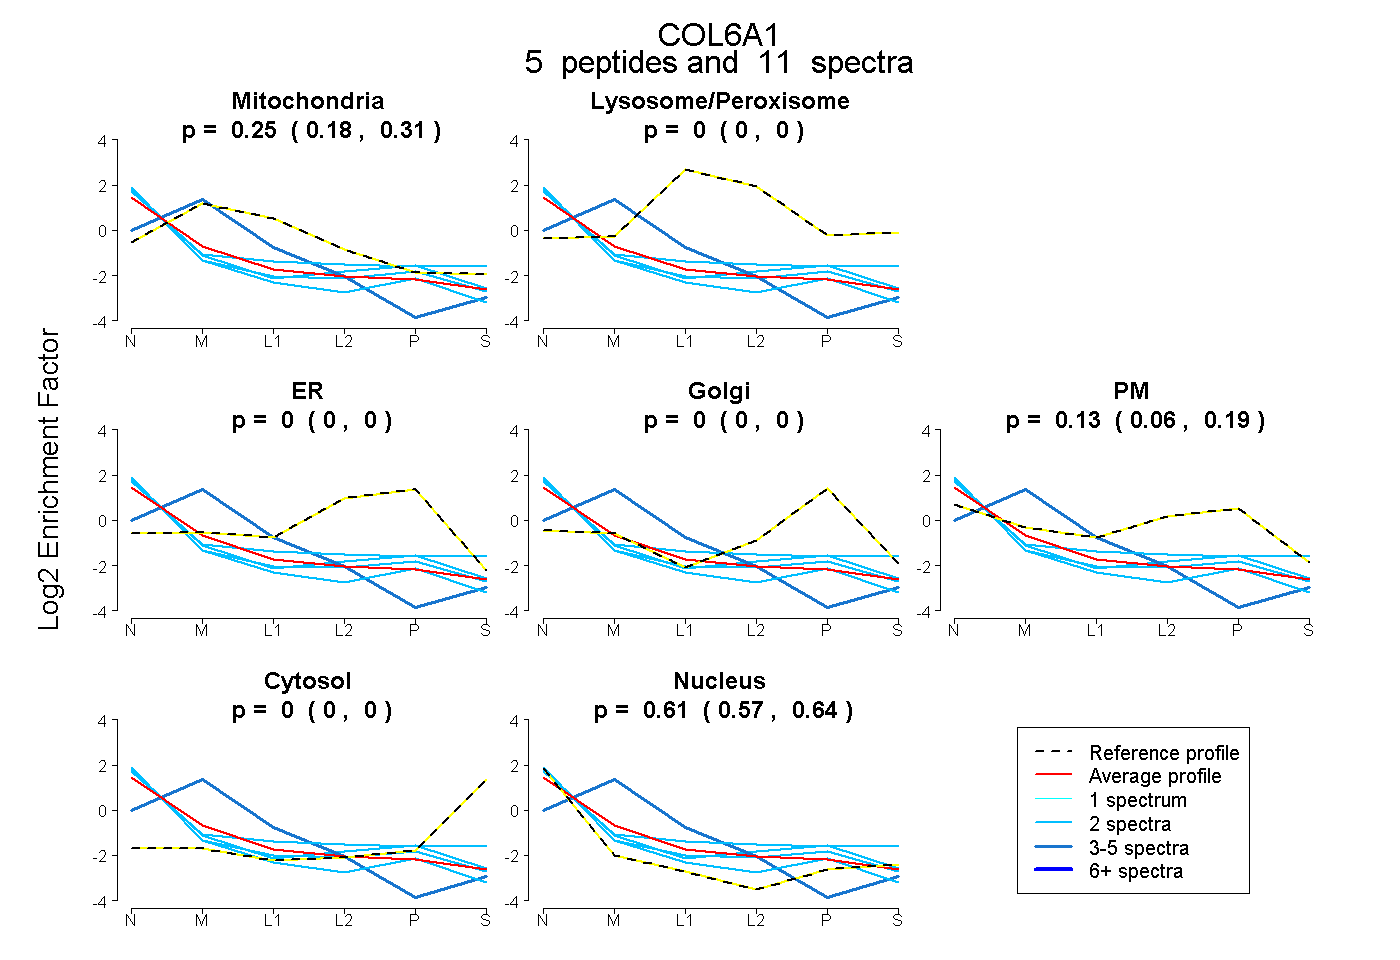
0.181 | 0.315
0.000 | 0.000
0.000 | 0.000
0.000 | 0.000
0.060 | 0.192
0.000 | 0.000
0.572 | 0.641
16peptides
spectra
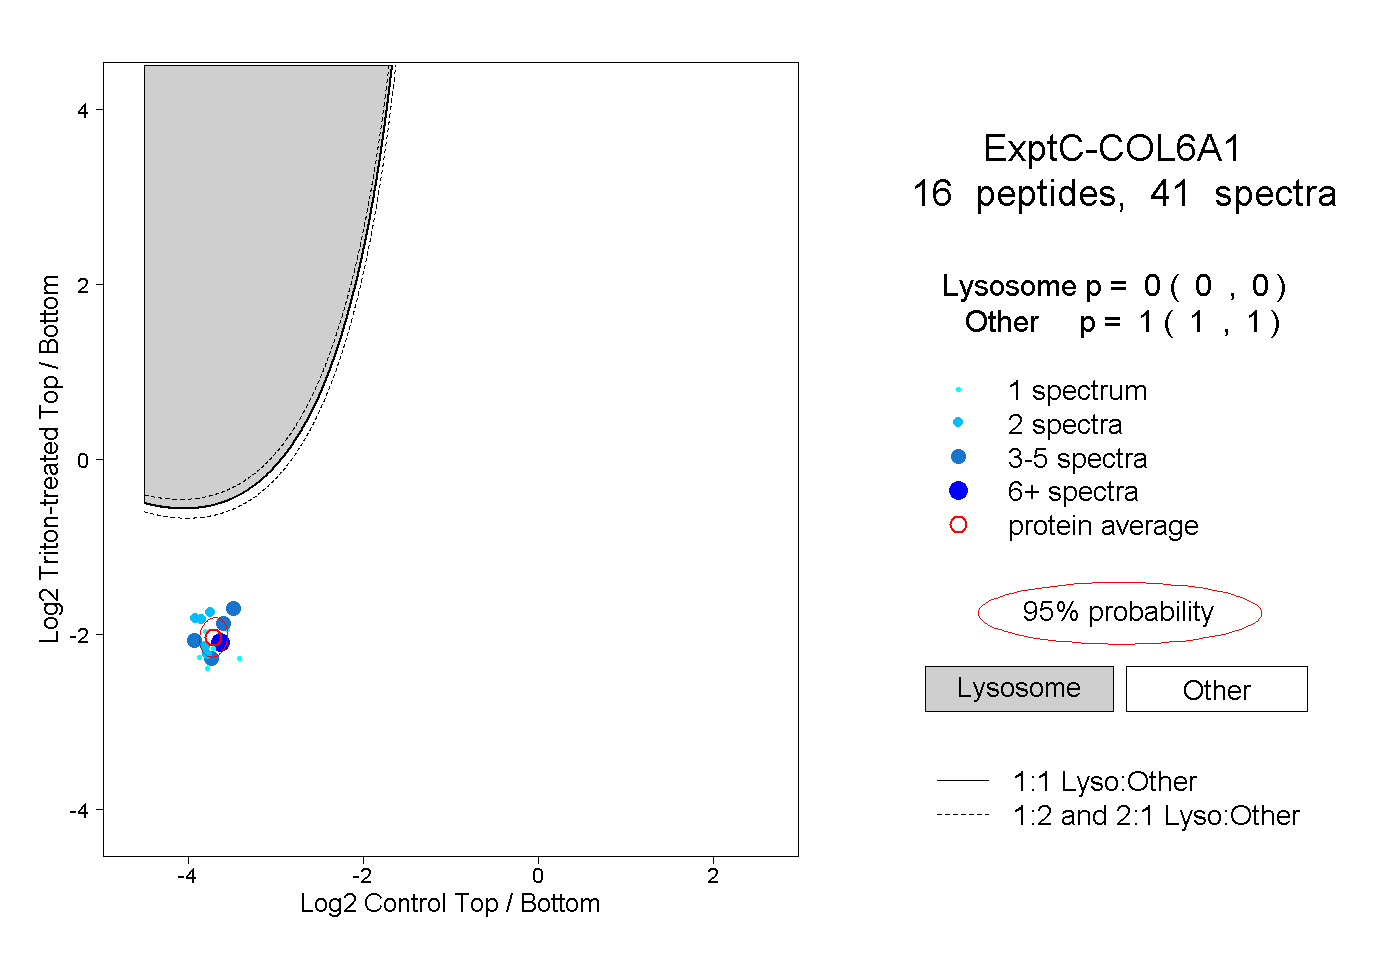
0.000 | 0.000
1.000 | 1.000
3peptides
spectra

0.000 | 0.003
0.997 | 1.000