 19
19peptides
spectra
0.000 | 0.000
0.108 | 0.129
0.000 | 0.000
0.000 | 0.000
0.000 | 0.000
0.149 | 0.178
0.000 | 0.000
0.710 | 0.719
| Plot | Mito | Lyso | Perox | ER | Golgi | PM | Cytosol | Nucleus | |||||
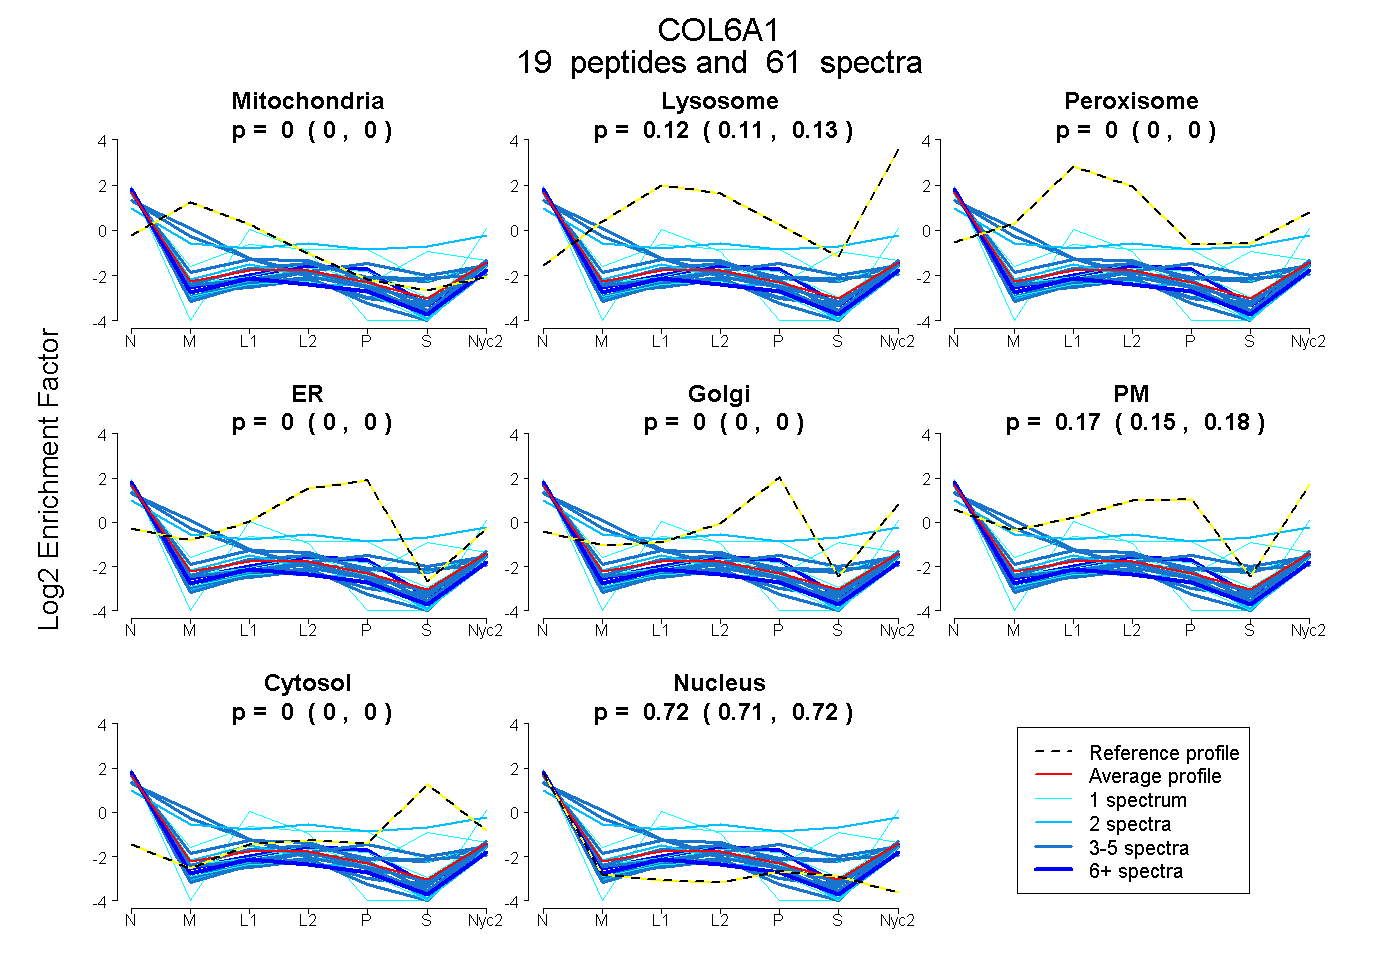
| Expt A |
19 peptides |
61 spectra |
|
0.000 0.000 | 0.000 |
0.120 0.108 | 0.129 |
0.000 0.000 | 0.000 |
0.000 0.000 | 0.000 |
0.000 0.000 | 0.000 |
0.165 0.149 | 0.178 |
0.000 0.000 | 0.000 |
0.715 0.710 | 0.719 |
| 2 spectra, VLLFSDGNSQGATAEAIEK | 0.091 | 0.000 | 0.116 | 0.000 | 0.000 | 0.347 | 0.255 | 0.191 | ||
| 4 spectra, ASIDAVK | 0.399 | 0.050 | 0.000 | 0.000 | 0.000 | 0.118 | 0.000 | 0.432 | ||
| 2 spectra, LKPYGALVDK | 0.046 | 0.000 | 0.000 | 0.000 | 0.000 | 0.276 | 0.000 | 0.678 | ||
| 1 spectrum, FEPGQSHAGVVQYSHNQMQEHVDMR | 0.000 | 0.300 | 0.027 | 0.000 | 0.000 | 0.000 | 0.000 | 0.673 | ||
| 1 spectrum, VLVTGK | 0.000 | 0.000 | 0.000 | 0.000 | 0.000 | 0.200 | 0.000 | 0.800 | ||
| 4 spectra, GTYTDCAIK | 0.000 | 0.000 | 0.166 | 0.000 | 0.000 | 0.118 | 0.026 | 0.690 | ||
| 2 spectra, GVLYQTVSR | 0.000 | 0.000 | 0.000 | 0.000 | 0.000 | 0.195 | 0.000 | 0.805 | ||
| 10 spectra, AVQEAQR | 0.000 | 0.000 | 0.000 | 0.000 | 0.000 | 0.334 | 0.000 | 0.666 | ||
| 4 spectra, LLPPTQNNR | 0.000 | 0.032 | 0.000 | 0.000 | 0.000 | 0.203 | 0.000 | 0.765 | ||
| 1 spectrum, EPCGGLEDAVNEAK | 0.000 | 0.000 | 0.079 | 0.000 | 0.000 | 0.096 | 0.294 | 0.531 | ||
| 3 spectra, FIDNLR | 0.000 | 0.072 | 0.000 | 0.000 | 0.000 | 0.107 | 0.000 | 0.821 | ||
| 4 spectra, TAEYDVAFGER | 0.000 | 0.130 | 0.000 | 0.000 | 0.000 | 0.044 | 0.000 | 0.827 | ||
| 4 spectra, IALVITDGR | 0.000 | 0.124 | 0.000 | 0.000 | 0.000 | 0.052 | 0.000 | 0.824 | ||
| 3 spectra, NAQDFK | 0.000 | 0.000 | 0.000 | 0.000 | 0.000 | 0.271 | 0.113 | 0.615 | ||
| 5 spectra, VAVVQYSGQGQQQPGR | 0.509 | 0.000 | 0.000 | 0.000 | 0.000 | 0.116 | 0.000 | 0.375 | ||
| 6 spectra, VPNYQALLR | 0.000 | 0.036 | 0.000 | 0.000 | 0.000 | 0.156 | 0.000 | 0.808 | ||
| 3 spectra, VFSVAITPDHLEPR | 0.100 | 0.000 | 0.027 | 0.000 | 0.000 | 0.276 | 0.000 | 0.597 | ||
| 1 spectrum, GDPGYEGER | 0.000 | 0.000 | 0.186 | 0.042 | 0.000 | 0.270 | 0.000 | 0.501 | ||
| 1 spectrum, GDEGPPGPEGLR | 0.000 | 0.000 | 0.000 | 0.000 | 0.000 | 0.333 | 0.000 | 0.667 |
| Plot | Mito | Lyso or Perox | ER | Golgi | PM | Cytosol | Nucleus | ||||||
| Expt B |
5 peptides |
11 spectra |
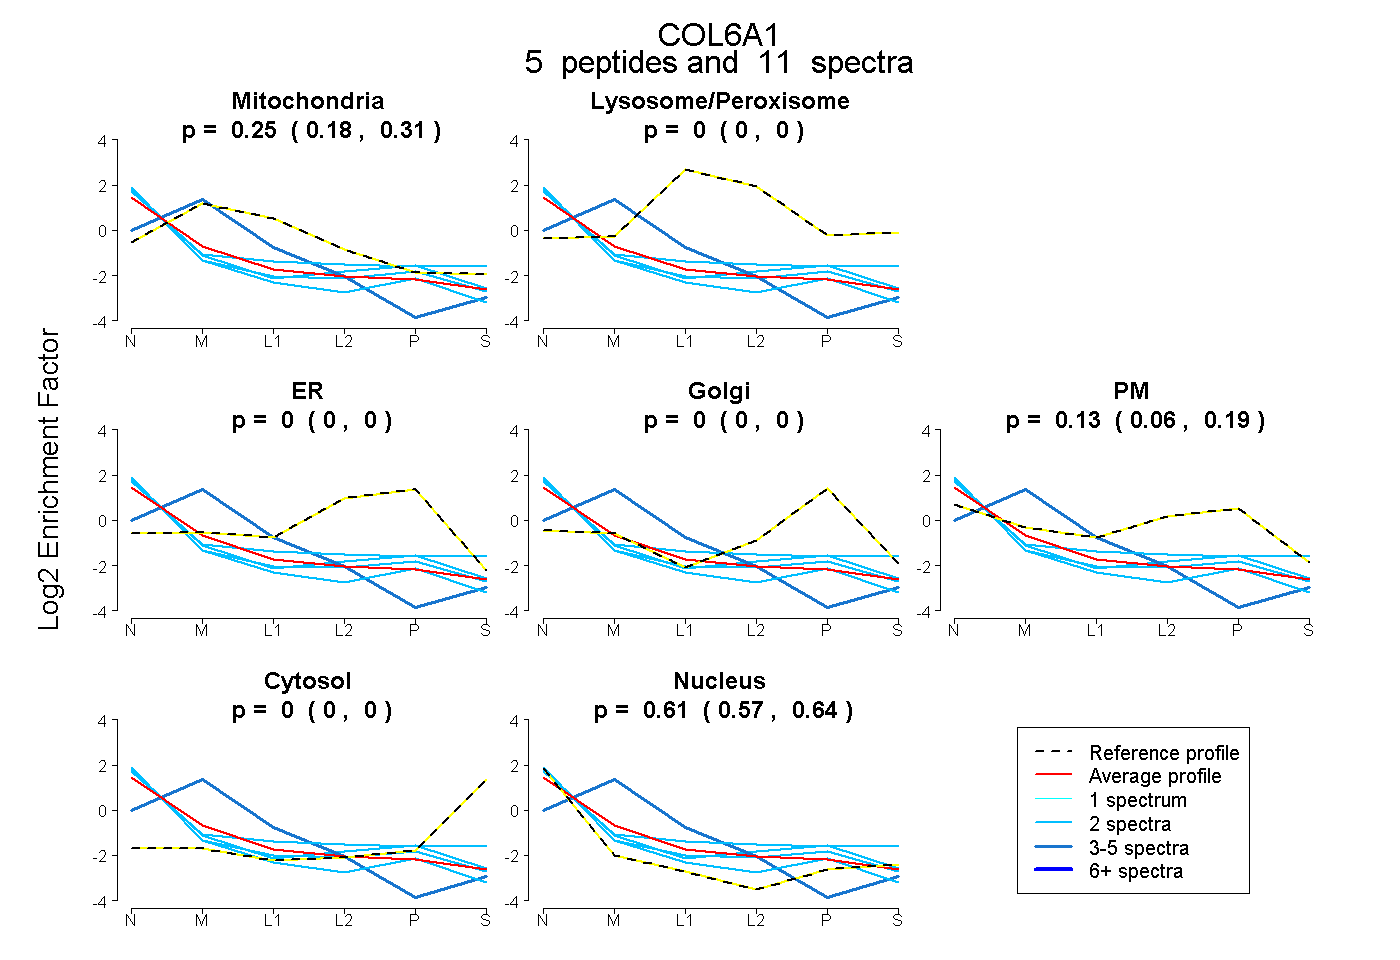 |
0.255 0.181 | 0.315 |
0.000 0.000 | 0.000 |
0.000 0.000 | 0.000 |
0.000 0.000 | 0.000 |
0.135 0.060 | 0.192 |
0.000 0.000 | 0.000 |
0.610 0.572 | 0.641 |
|||
| Plot | Lyso | Other | |||||||||||
| Expt C |
16 peptides |
41 spectra |
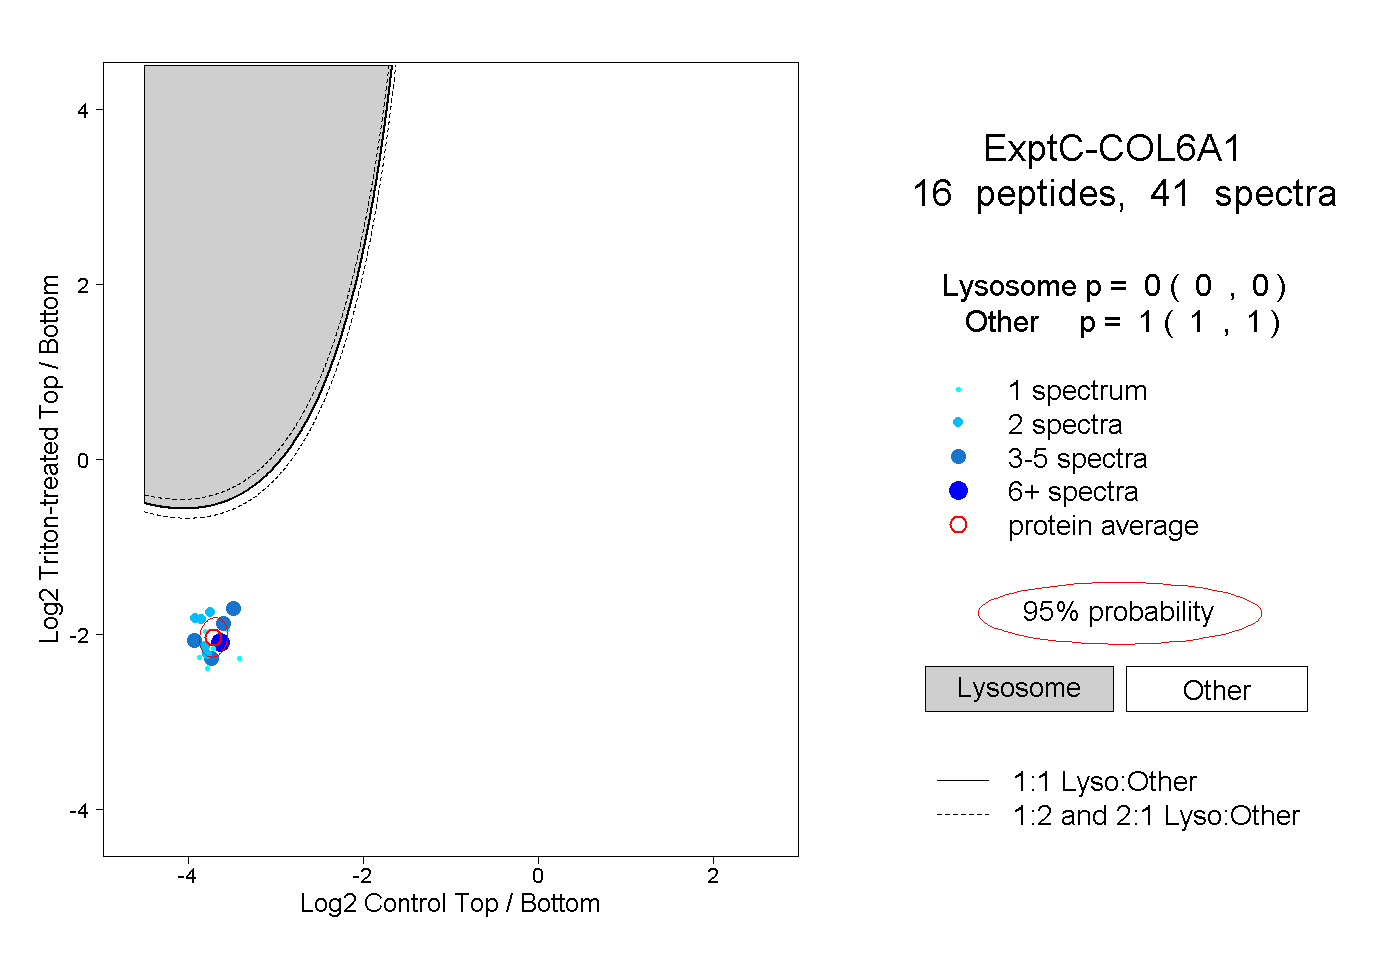 |
0.000 0.000 | 0.000 |
1.000 1.000 | 1.000 |
||||||||
| Plot | Lyso | Other | |||||||||||
| Expt D |
3 peptides |
8 spectra |
 |
0.000 0.000 | 0.003 |
1.000 0.997 | 1.000 |