 6
6peptides
spectra
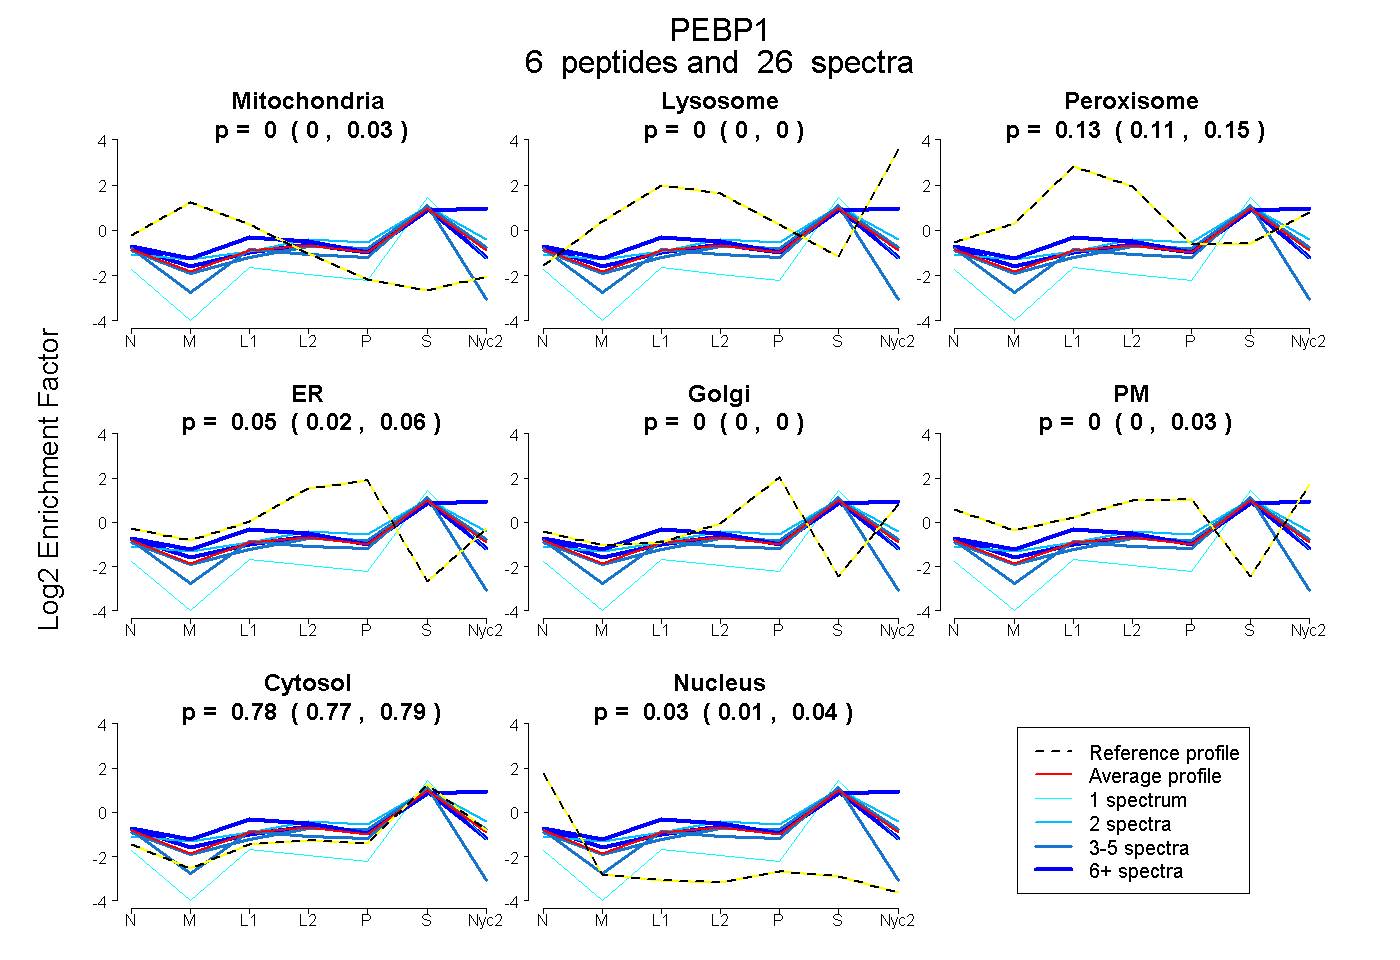
0.000 | 0.032
0.000 | 0.000
0.105 | 0.146
0.023 | 0.064
0.000 | 0.000
0.000 | 0.026
0.768 | 0.792
0.009 | 0.041
6peptides
spectra
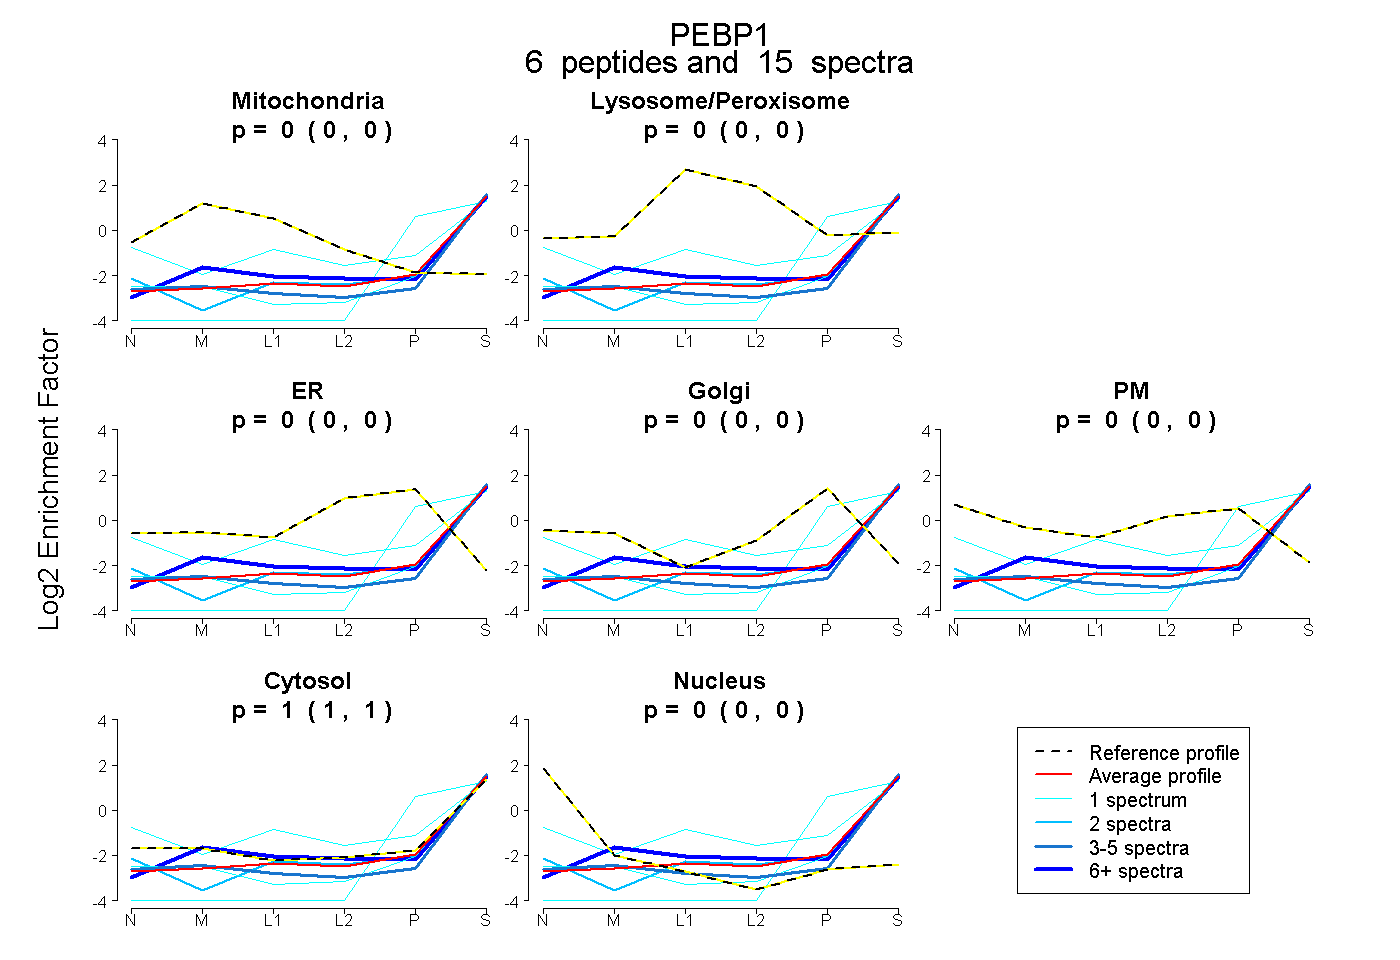
0.000 | 0.000
0.000 | 0.000
0.000 | 0.000
0.000 | 0.000
0.000 | 0.000
1.000 | 1.000
0.000 | 0.000
6peptides
spectra
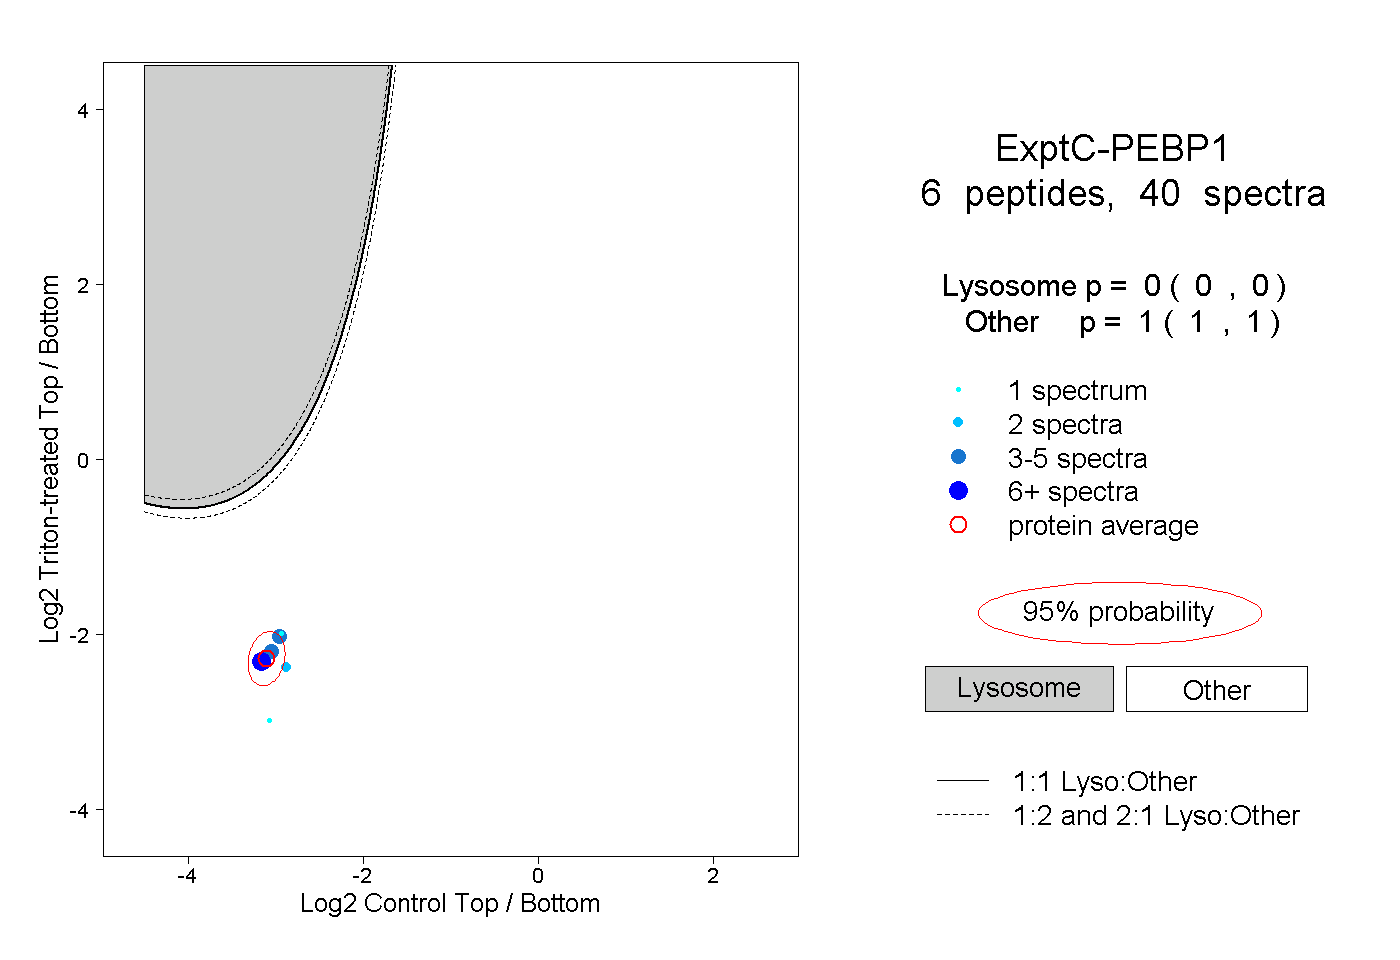
0.000 | 0.000
1.000 | 1.000
1peptide
spectra
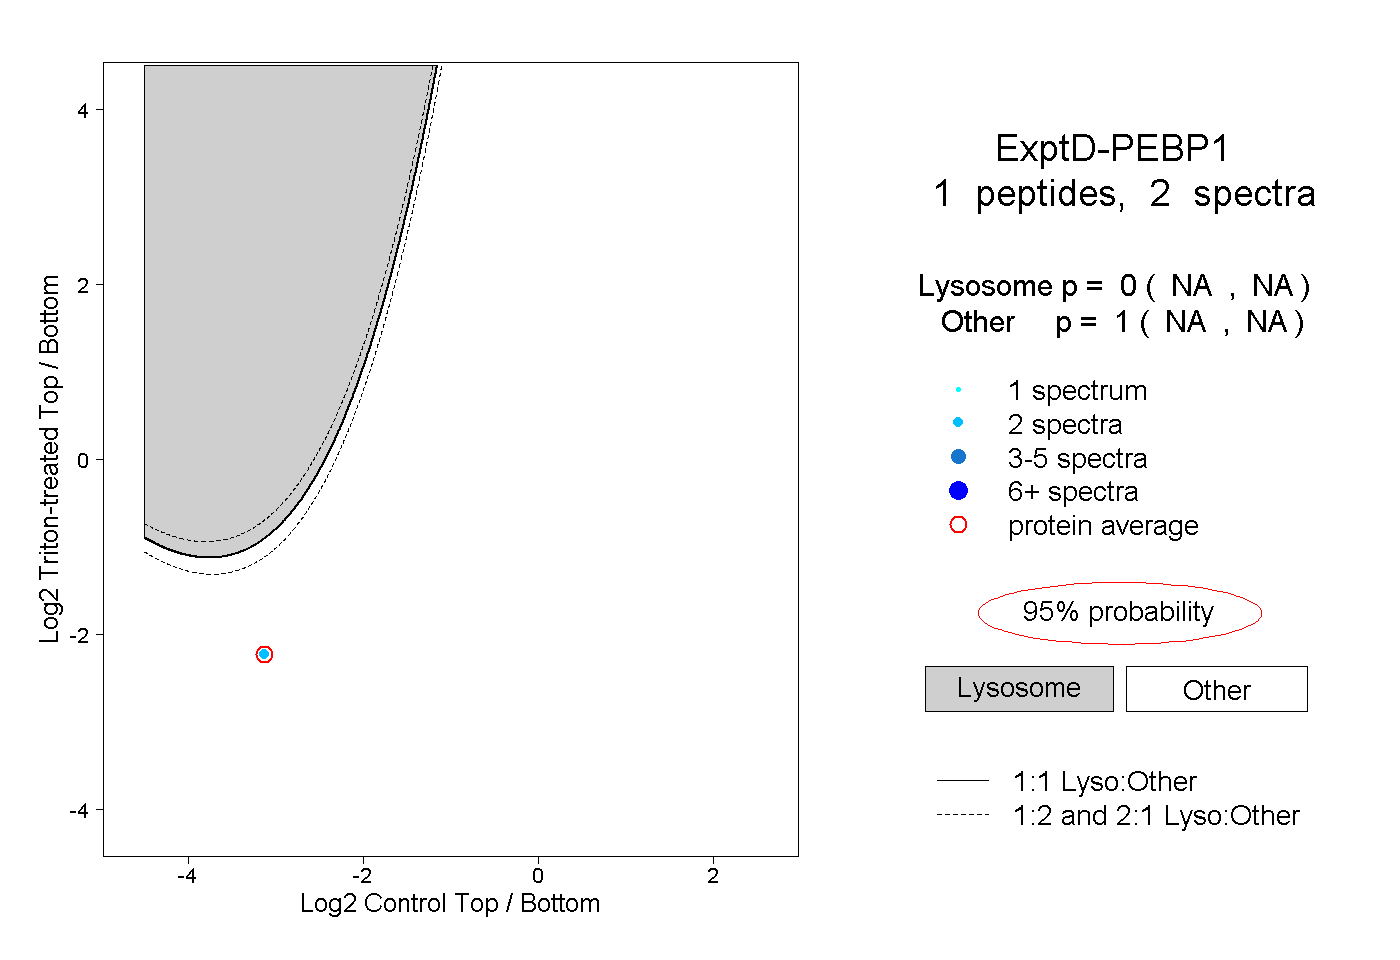
NA | NA
NA | NA