 6
6peptides
spectra
0.000 | 0.032
0.000 | 0.000
0.105 | 0.146
0.023 | 0.064
0.000 | 0.000
0.000 | 0.026
0.768 | 0.792
0.009 | 0.041
| Plot | Mito | Lyso | Perox | ER | Golgi | PM | Cytosol | Nucleus | |||||
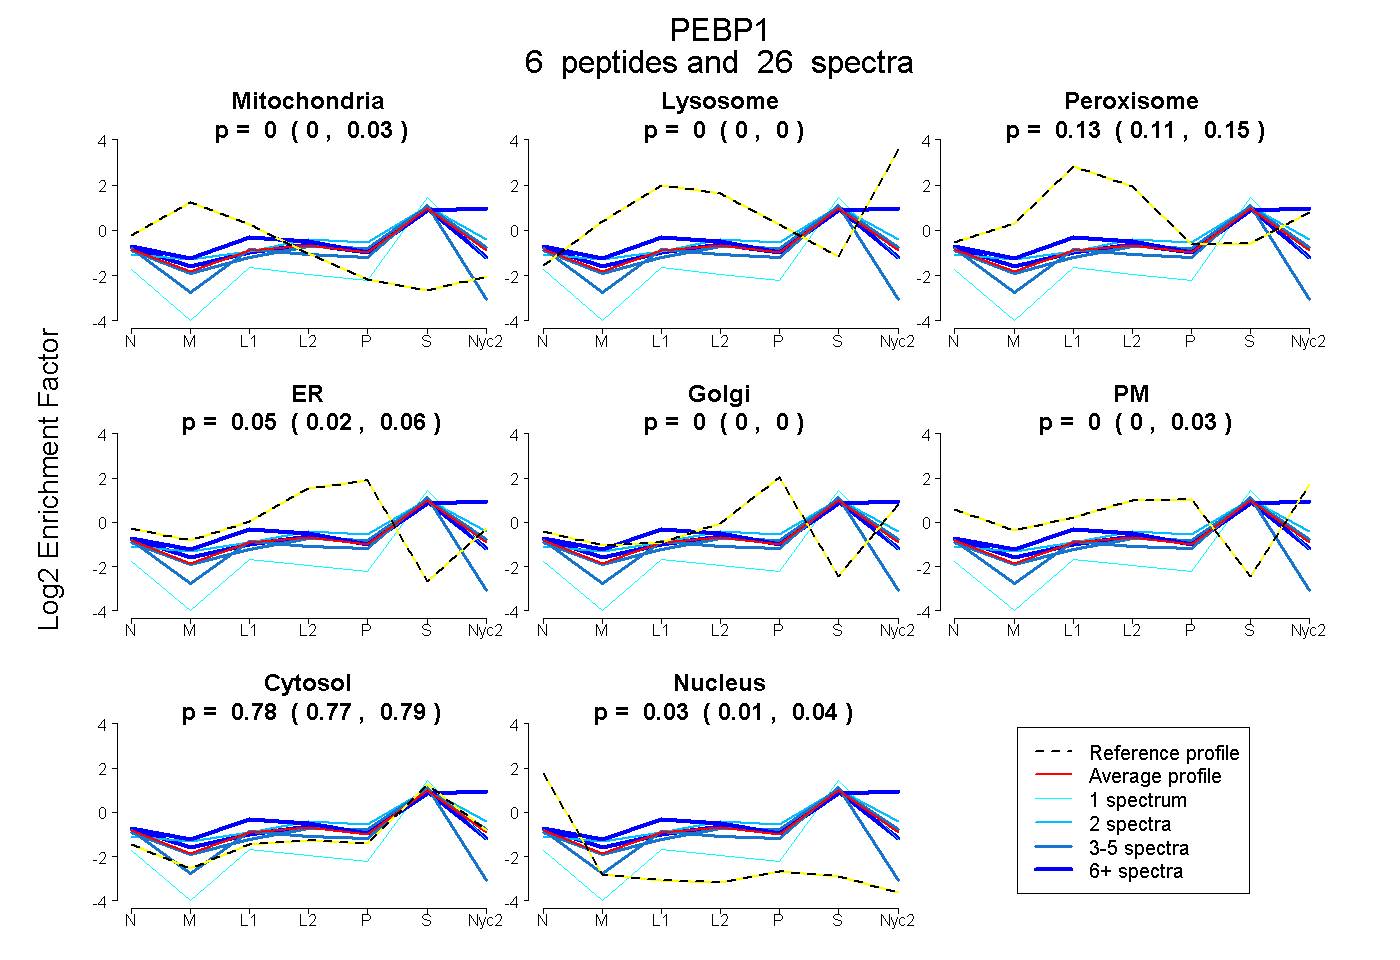
| Expt A |
6 peptides |
26 spectra |
|
0.005 0.000 | 0.032 |
0.000 0.000 | 0.000 |
0.134 0.105 | 0.146 |
0.052 0.023 | 0.064 |
0.000 0.000 | 0.000 |
0.000 0.000 | 0.026 |
0.779 0.768 | 0.792 |
0.030 0.009 | 0.041 |
| 5 spectra, LHDQLAGK | 0.000 | 0.000 | 0.046 | 0.100 | 0.000 | 0.022 | 0.832 | 0.000 | ||
| 1 spectrum, GNDISSGTVLSEYVGSGPPK | 0.000 | 0.000 | 0.000 | 0.000 | 0.000 | 0.000 | 0.945 | 0.055 | ||
| 3 spectra, VDYGGVTVDELGK | 0.000 | 0.000 | 0.033 | 0.000 | 0.000 | 0.000 | 0.791 | 0.176 | ||
| 7 spectra, DTGLHR | 0.079 | 0.000 | 0.082 | 0.067 | 0.000 | 0.000 | 0.763 | 0.009 | ||
| 8 spectra, LYTLVLTDPDAPSR | 0.000 | 0.303 | 0.017 | 0.000 | 0.000 | 0.033 | 0.647 | 0.000 | ||
| 2 spectra, EWHHFLVVNMK | 0.000 | 0.004 | 0.178 | 0.004 | 0.103 | 0.000 | 0.711 | 0.000 |
| Plot | Mito | Lyso or Perox | ER | Golgi | PM | Cytosol | Nucleus | ||||||
| Expt B |
6 peptides |
15 spectra |
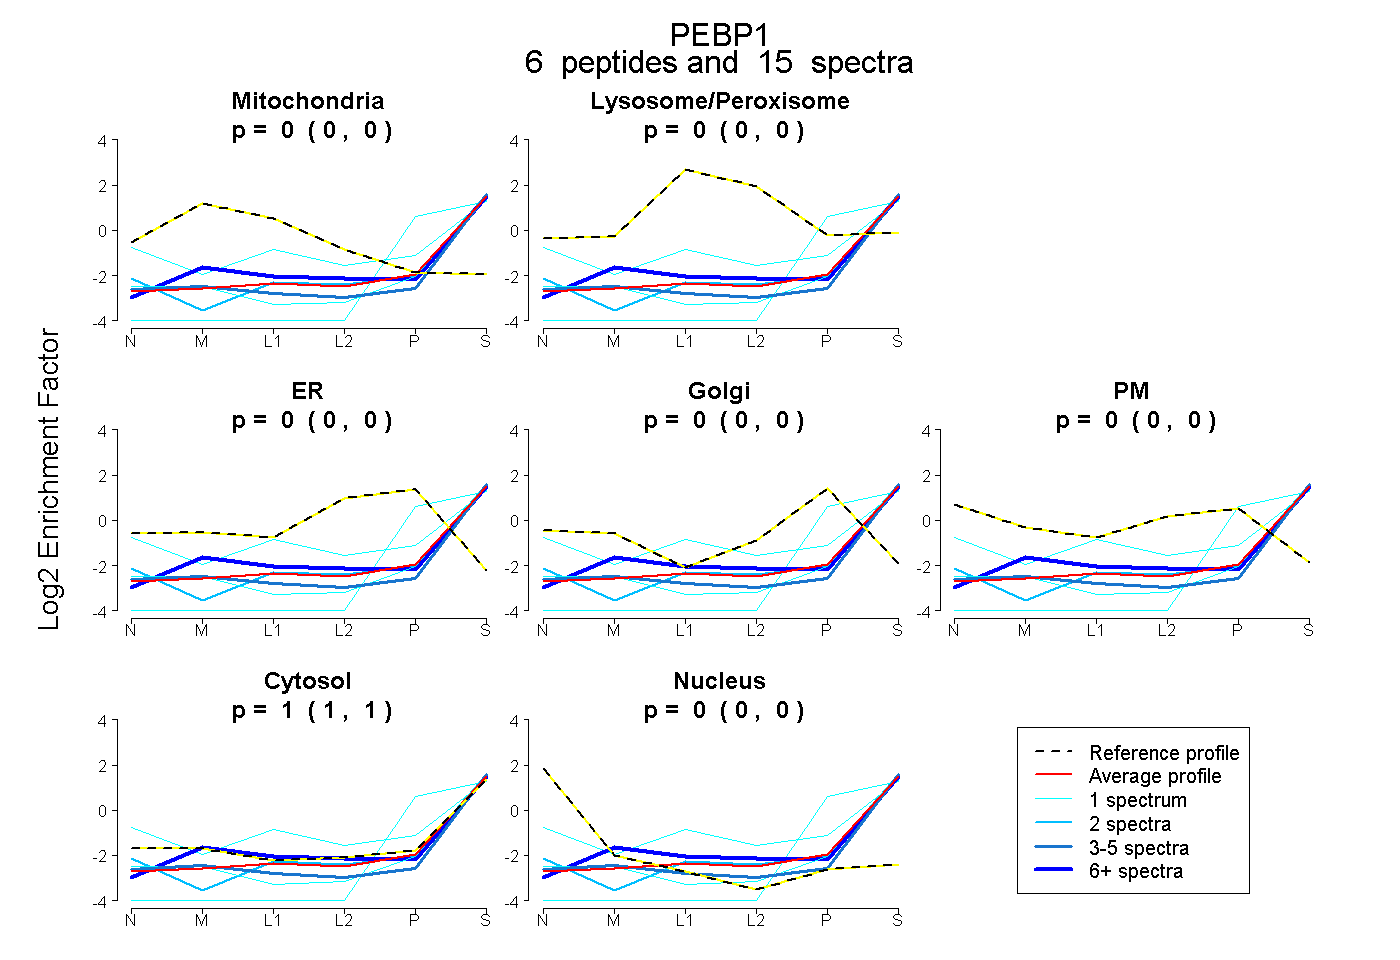 |
0.000 0.000 | 0.000 |
0.000 0.000 | 0.000 |
0.000 0.000 | 0.000 |
0.000 0.000 | 0.000 |
0.000 0.000 | 0.000 |
1.000 1.000 | 1.000 |
0.000 0.000 | 0.000 |
|||
| Plot | Lyso | Other | |||||||||||
| Expt C |
6 peptides |
40 spectra |
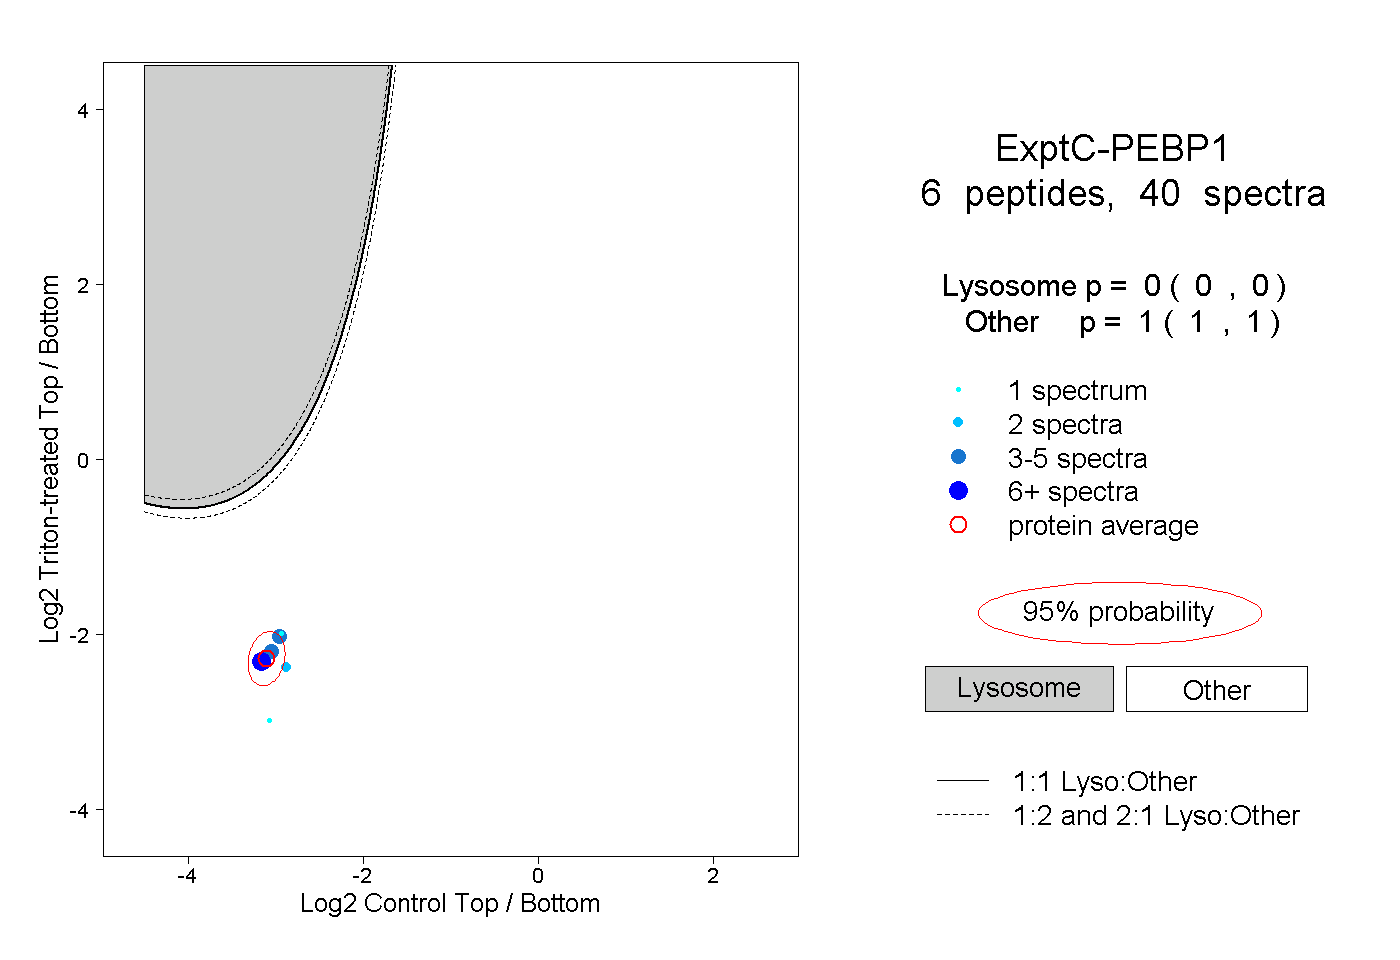 |
0.000 0.000 | 0.000 |
1.000 1.000 | 1.000 |
||||||||
| Plot | Lyso | Other | |||||||||||
| Expt D |
1 peptide |
2 spectra |
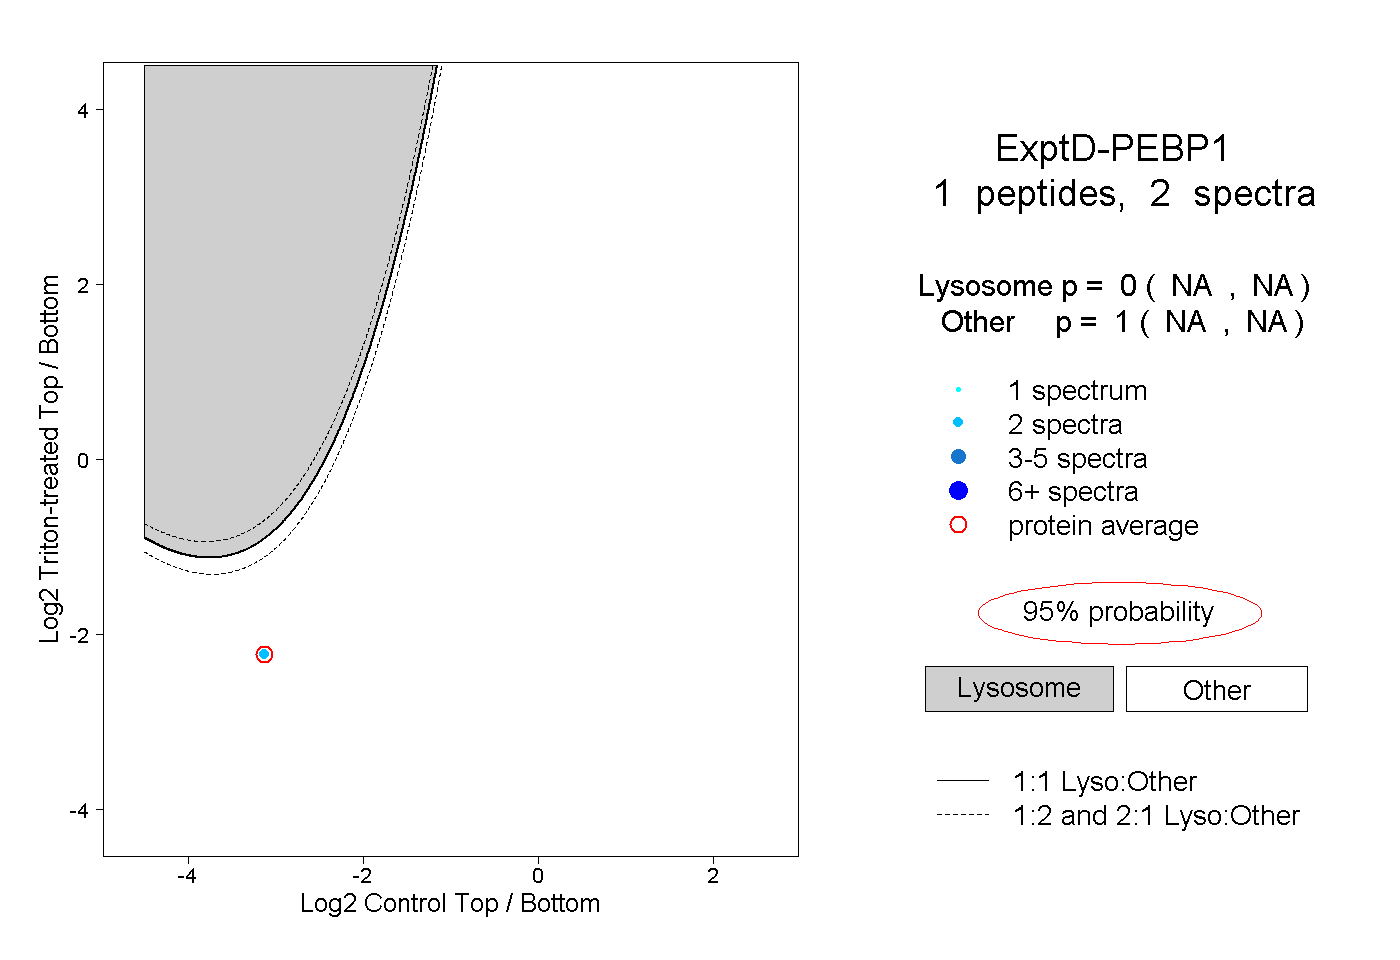 |
0.000 NA | NA |
1.000 NA | NA |