 12
12peptides
spectra
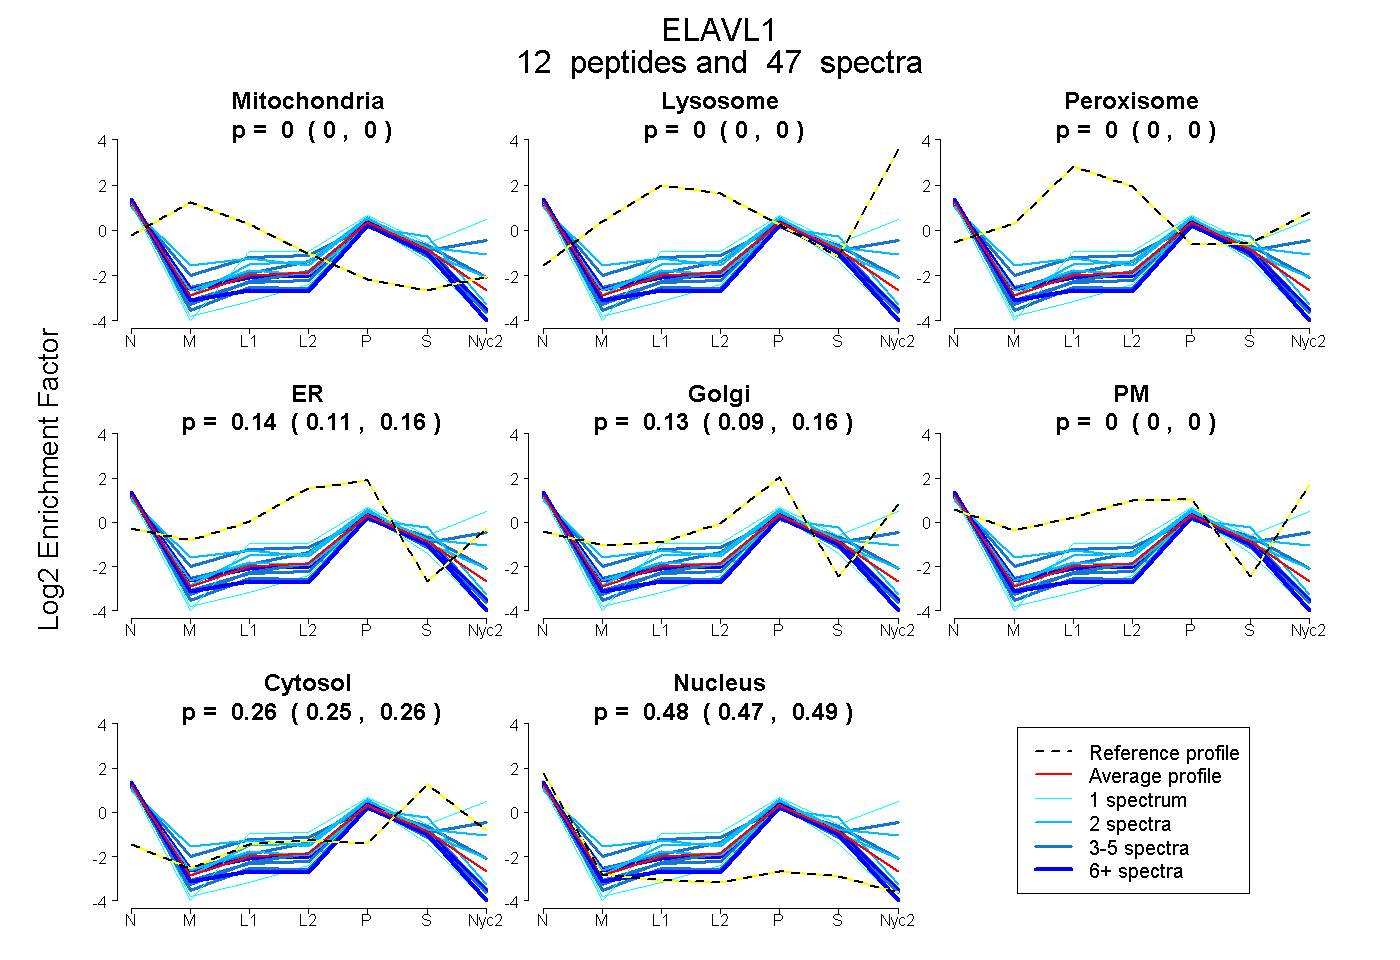
0.000 | 0.000
0.000 | 0.000
0.000 | 0.000
0.106 | 0.163
0.089 | 0.161
0.000 | 0.000
0.251 | 0.259
0.471 | 0.488
6peptides
spectra
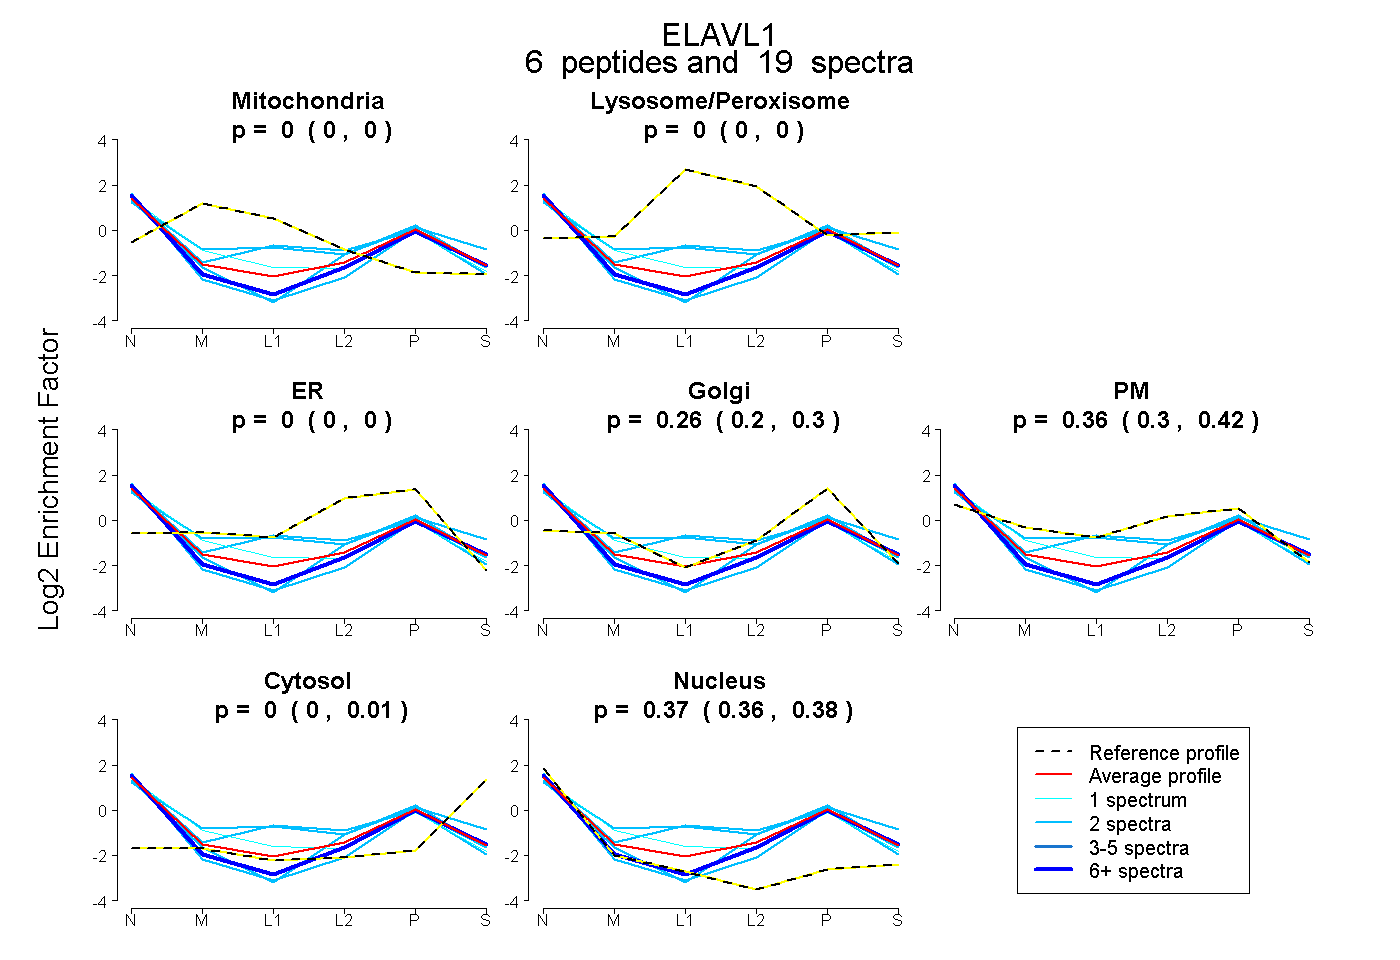
0.000 | 0.000
0.000 | 0.000
0.000 | 0.000
0.202 | 0.303
0.305 | 0.422
0.000 | 0.013
0.356 | 0.385
9peptides
spectra
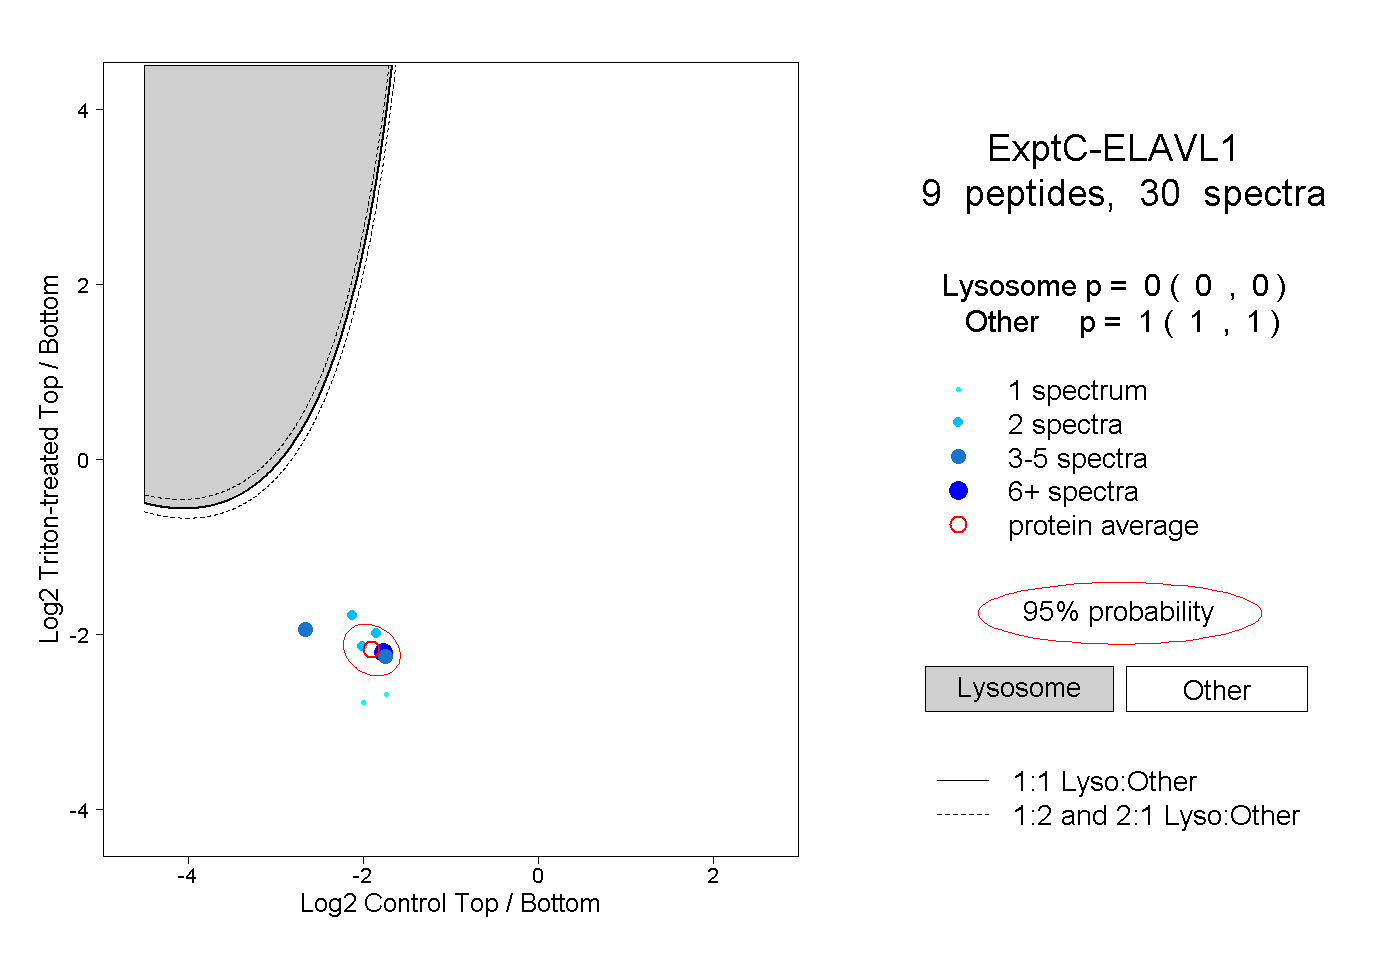
0.000 | 0.000
1.000 | 1.000
2peptides
spectra
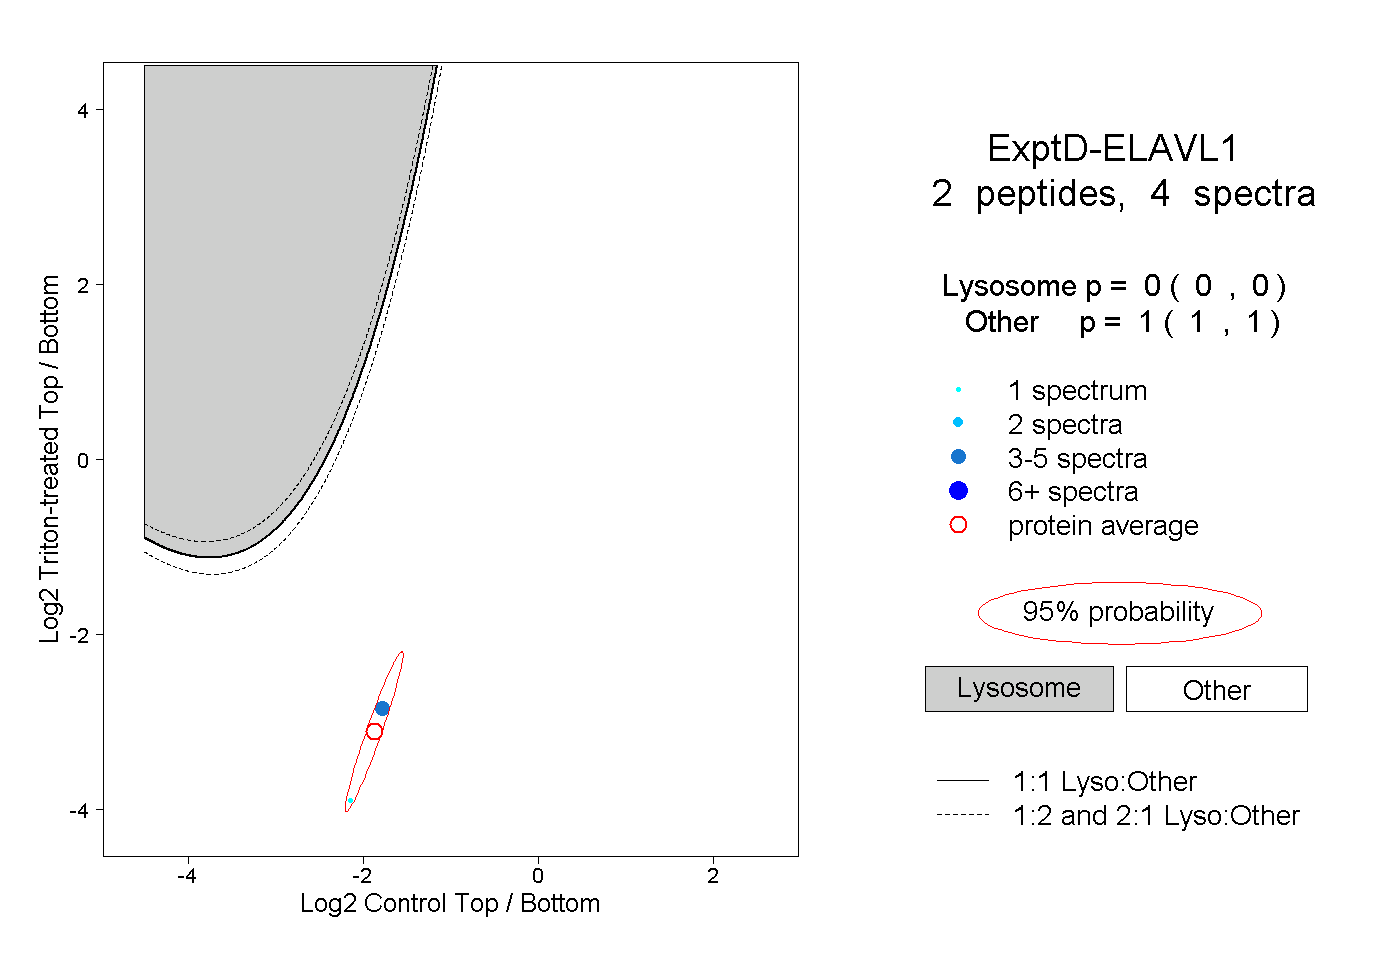
0.000 | 0.000
1.000 | 1.000