 12
12peptides
spectra
0.000 | 0.000
0.000 | 0.000
0.000 | 0.000
0.106 | 0.163
0.089 | 0.161
0.000 | 0.000
0.251 | 0.259
0.471 | 0.488
| Plot | Mito | Lyso | Perox | ER | Golgi | PM | Cytosol | Nucleus | |||||
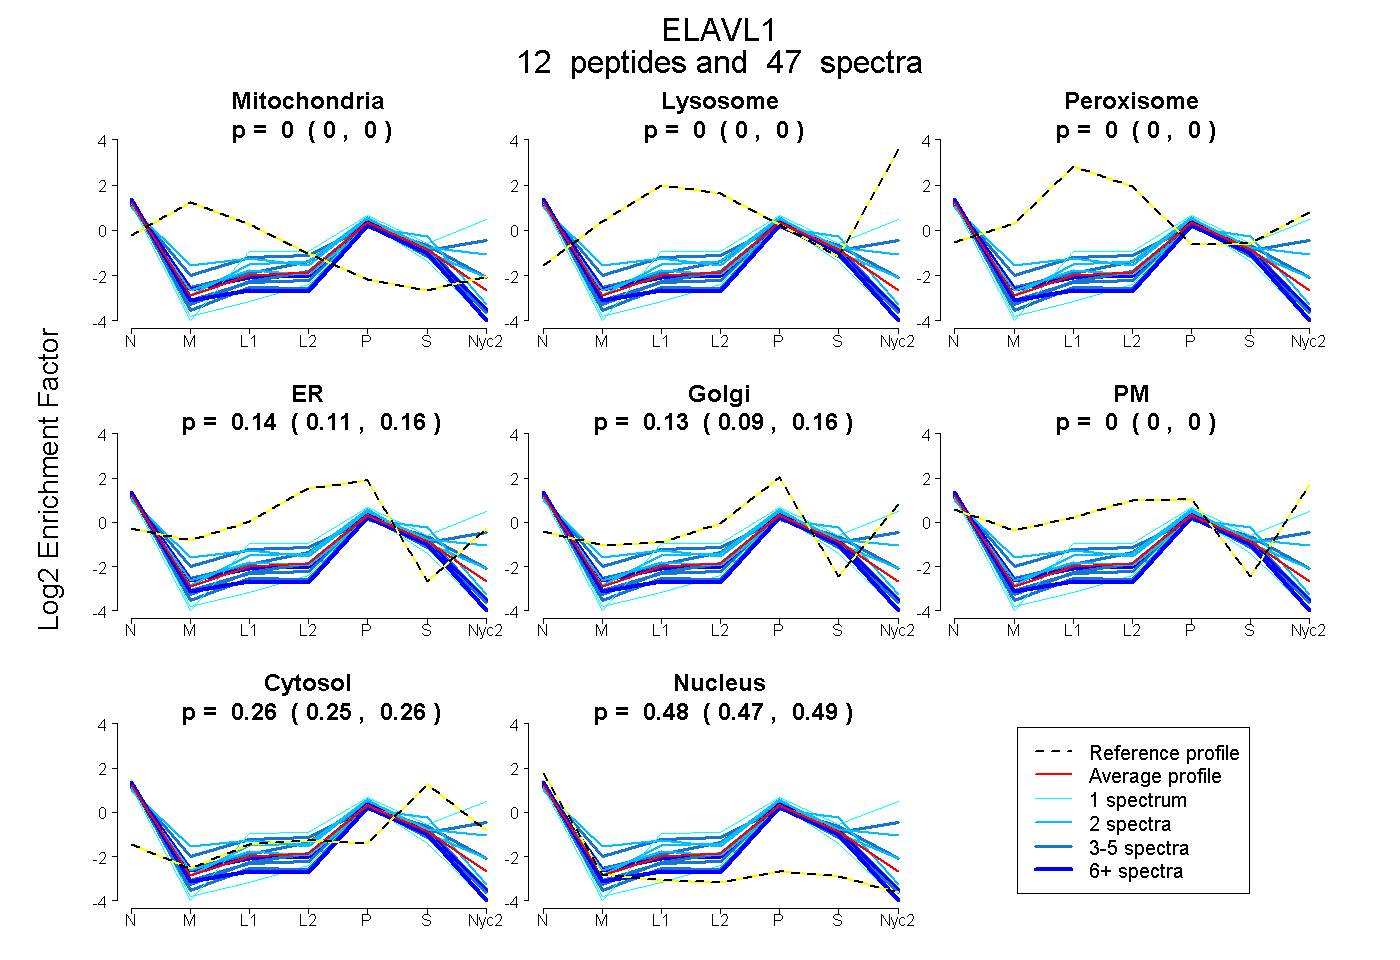
| Expt A |
12 peptides |
47 spectra |
|
0.000 0.000 | 0.000 |
0.000 0.000 | 0.000 |
0.000 0.000 | 0.000 |
0.136 0.106 | 0.163 |
0.129 0.089 | 0.161 |
0.000 0.000 | 0.000 |
0.255 0.251 | 0.259 |
0.480 0.471 | 0.488 |
| 6 spectra, VLVDQTTGLSR | 0.000 | 0.000 | 0.000 | 0.075 | 0.047 | 0.000 | 0.201 | 0.677 | ||
| 2 spectra, FGGPVHHQAQR | 0.000 | 0.000 | 0.000 | 0.219 | 0.150 | 0.000 | 0.242 | 0.389 | ||
| 1 spectrum, SLFSSIGEVESAK | 0.000 | 0.000 | 0.000 | 0.000 | 0.302 | 0.177 | 0.386 | 0.135 | ||
| 4 spectra, DANLYISGLPR | 0.000 | 0.000 | 0.000 | 0.353 | 0.000 | 0.000 | 0.309 | 0.339 | ||
| 1 spectrum, FAANPNQNK | 0.000 | 0.000 | 0.000 | 0.055 | 0.091 | 0.000 | 0.132 | 0.722 | ||
| 2 spectra, NMALLSQLYHSPAR | 0.000 | 0.000 | 0.002 | 0.000 | 0.380 | 0.087 | 0.259 | 0.272 | ||
| 3 spectra, AISTLNGLR | 0.000 | 0.000 | 0.000 | 0.000 | 0.431 | 0.036 | 0.254 | 0.280 | ||
| 5 spectra, DFNTNK | 0.000 | 0.000 | 0.000 | 0.157 | 0.000 | 0.000 | 0.271 | 0.572 | ||
| 2 spectra, VAGHSLGYGFVNYVTAK | 0.000 | 0.000 | 0.000 | 0.171 | 0.000 | 0.000 | 0.365 | 0.464 | ||
| 12 spectra, DVEDMFSR | 0.000 | 0.000 | 0.000 | 0.223 | 0.000 | 0.000 | 0.224 | 0.552 | ||
| 4 spectra, GVAFIR | 0.000 | 0.000 | 0.000 | 0.104 | 0.000 | 0.000 | 0.239 | 0.657 | ||
| 5 spectra, ILQVSFK | 0.000 | 0.000 | 0.000 | 0.221 | 0.000 | 0.000 | 0.184 | 0.595 |
| Plot | Mito | Lyso or Perox | ER | Golgi | PM | Cytosol | Nucleus | ||||||
| Expt B |
6 peptides |
19 spectra |
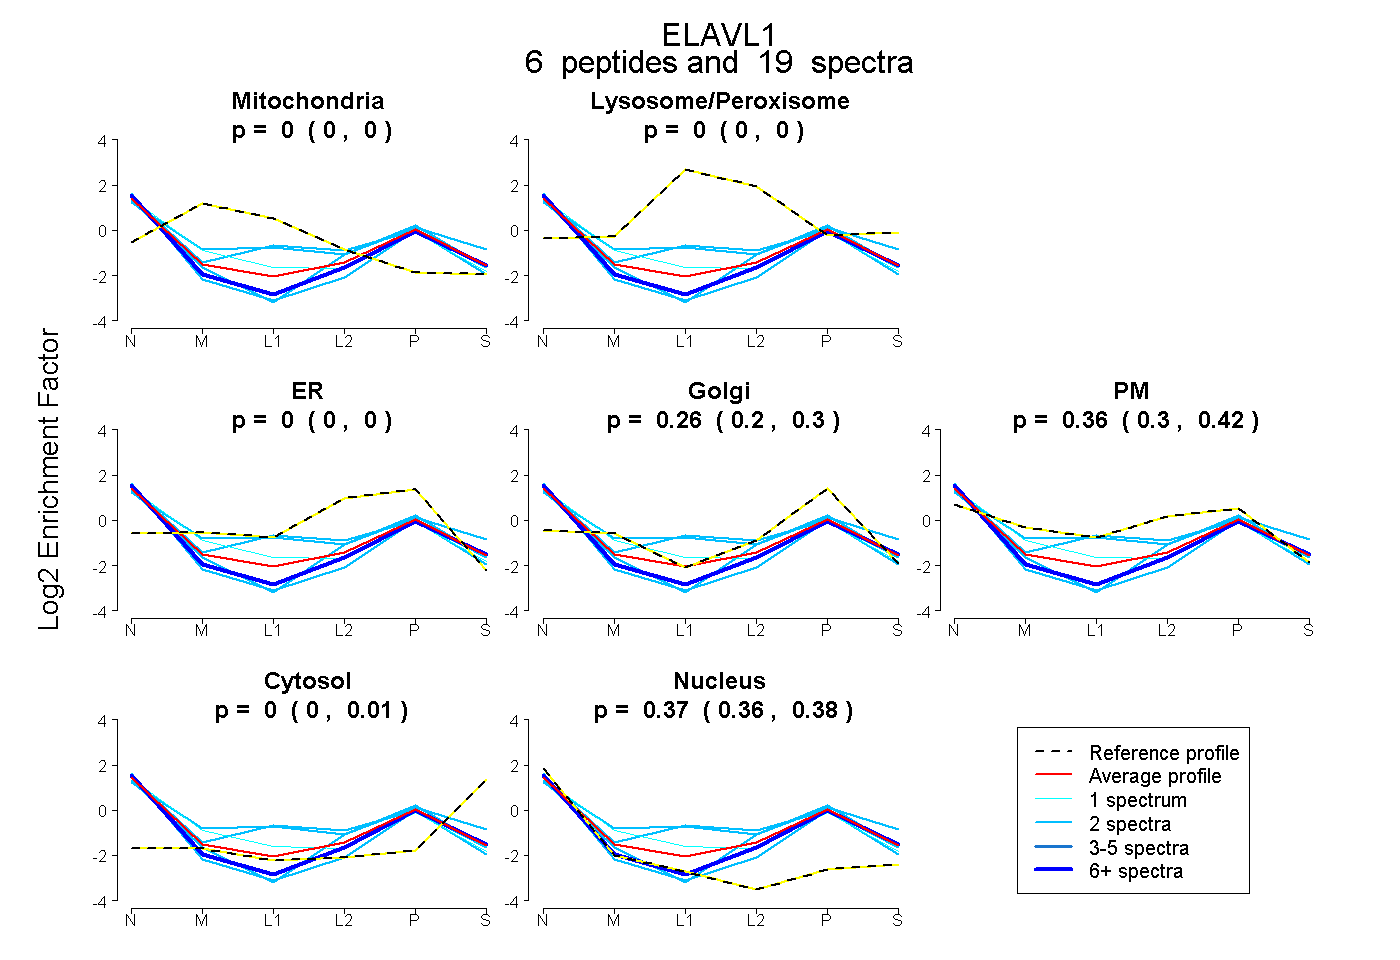 |
0.000 0.000 | 0.000 |
0.000 0.000 | 0.000 |
0.000 0.000 | 0.000 |
0.262 0.202 | 0.303 |
0.363 0.305 | 0.422 |
0.002 0.000 | 0.013 |
0.374 0.356 | 0.385 |
|||
| Plot | Lyso | Other | |||||||||||
| Expt C |
9 peptides |
30 spectra |
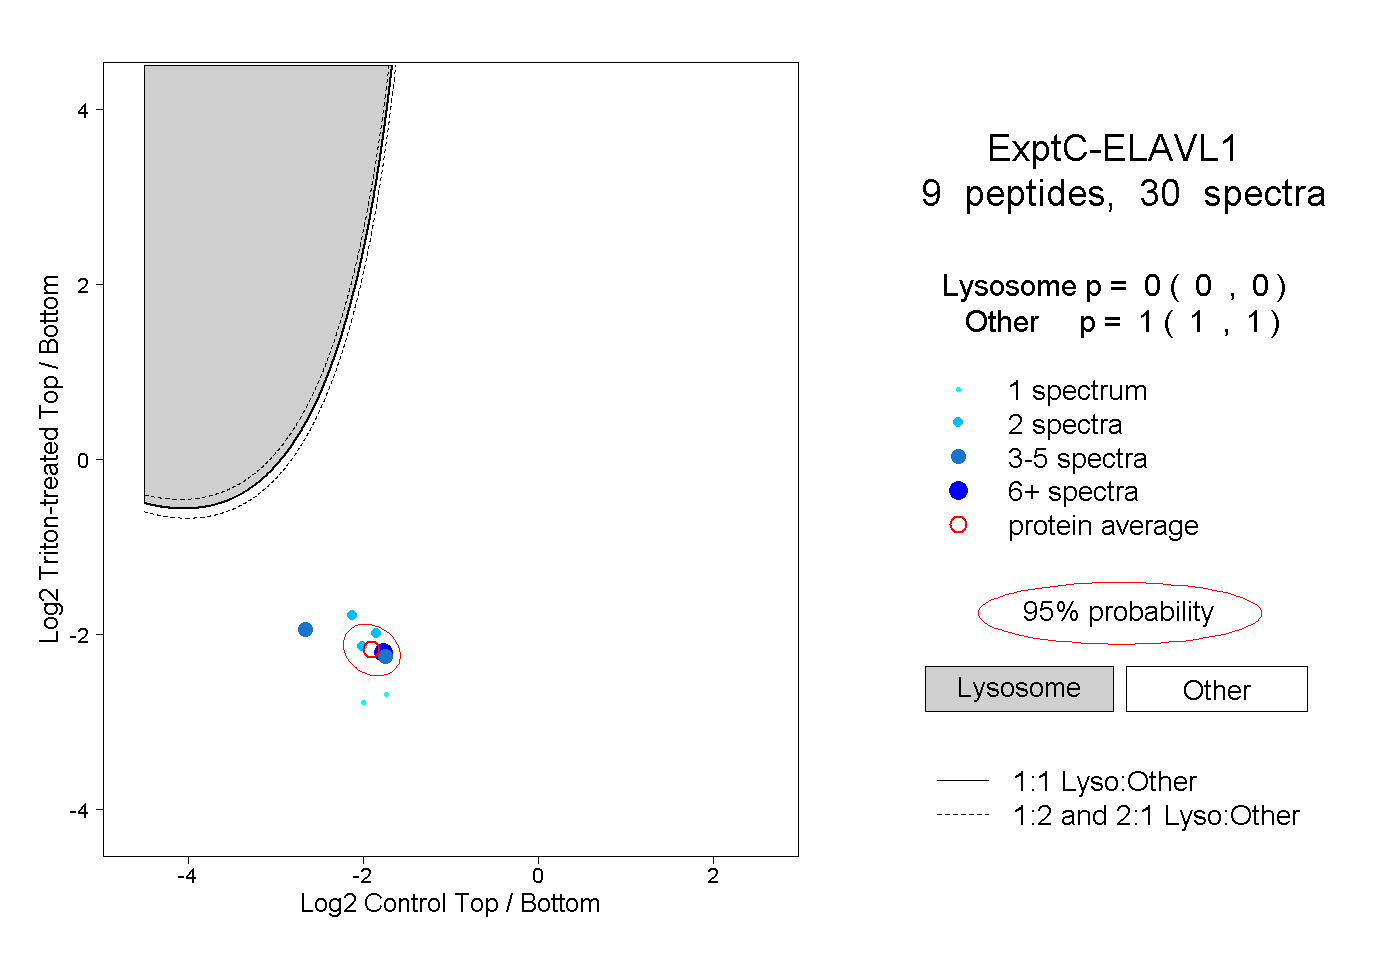 |
0.000 0.000 | 0.000 |
1.000 1.000 | 1.000 |
||||||||
| Plot | Lyso | Other | |||||||||||
| Expt D |
2 peptides |
4 spectra |
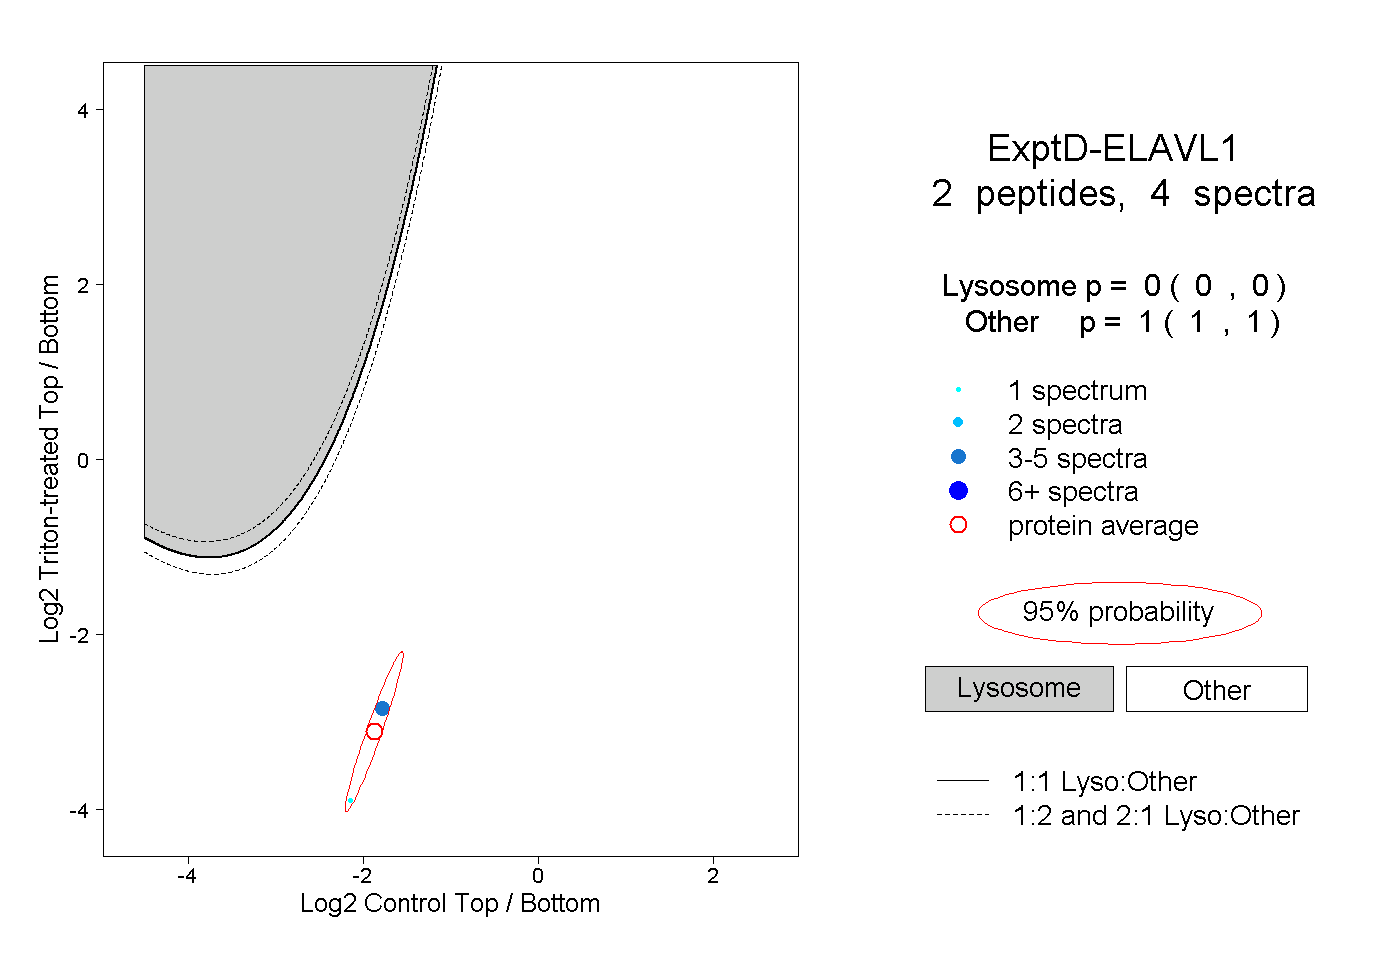 |
0.000 0.000 | 0.000 |
1.000 1.000 | 1.000 |