 11
11peptides
spectra

0.000 | 0.000
0.000 | 0.000
0.097 | 0.114
0.000 | 0.000
0.000 | 0.000
0.669 | 0.687
0.210 | 0.221
0.000 | 0.000
3peptides
spectra
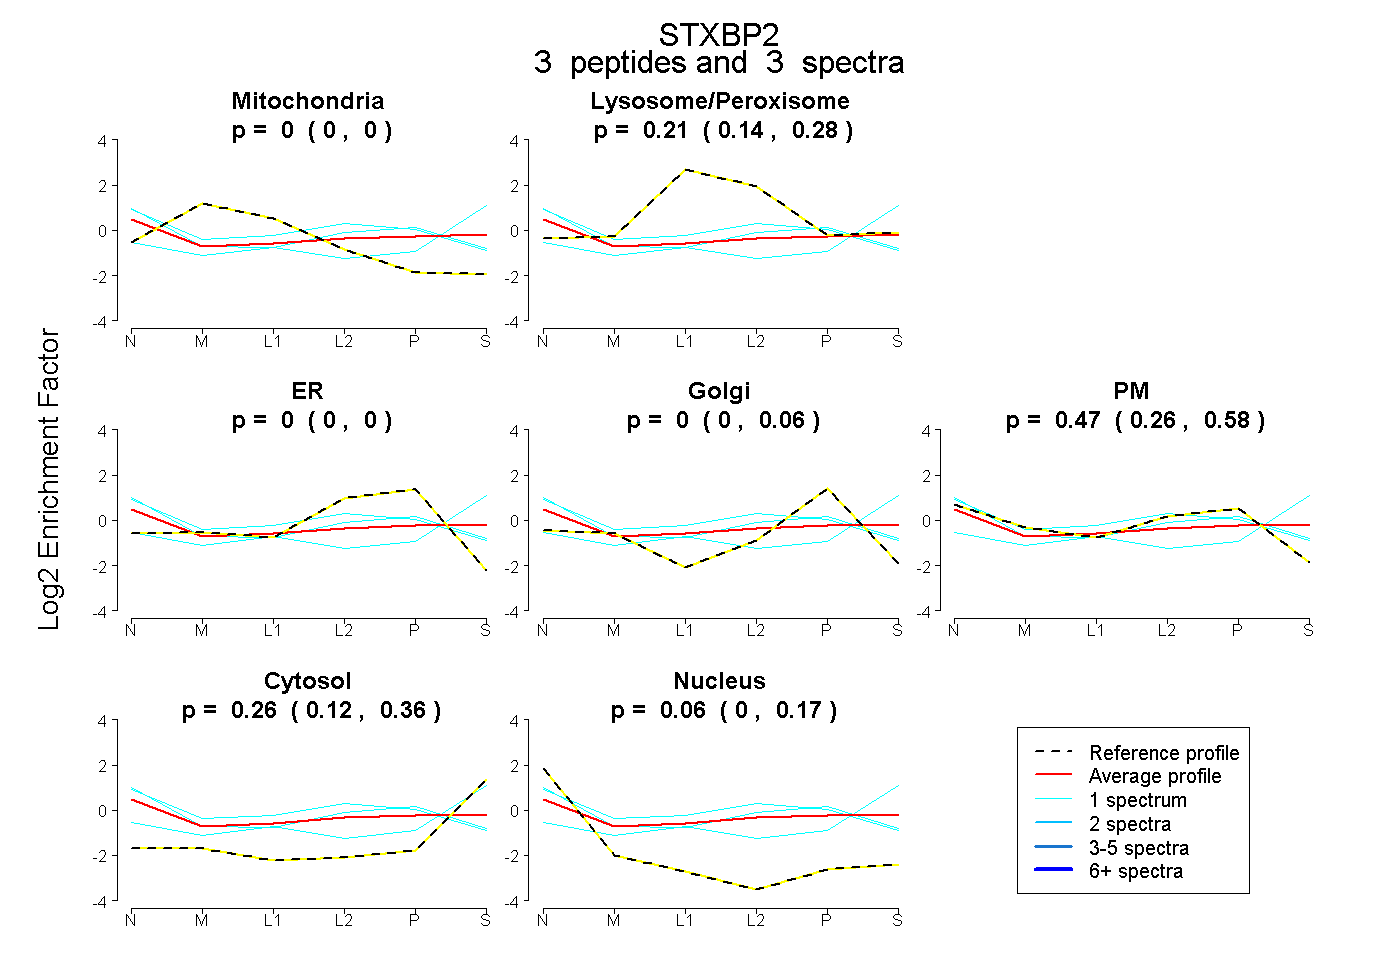
0.000 | 0.000
0.139 | 0.285
0.000 | 0.000
0.000 | 0.064
0.259 | 0.580
0.119 | 0.361
0.000 | 0.167
16peptides
spectra
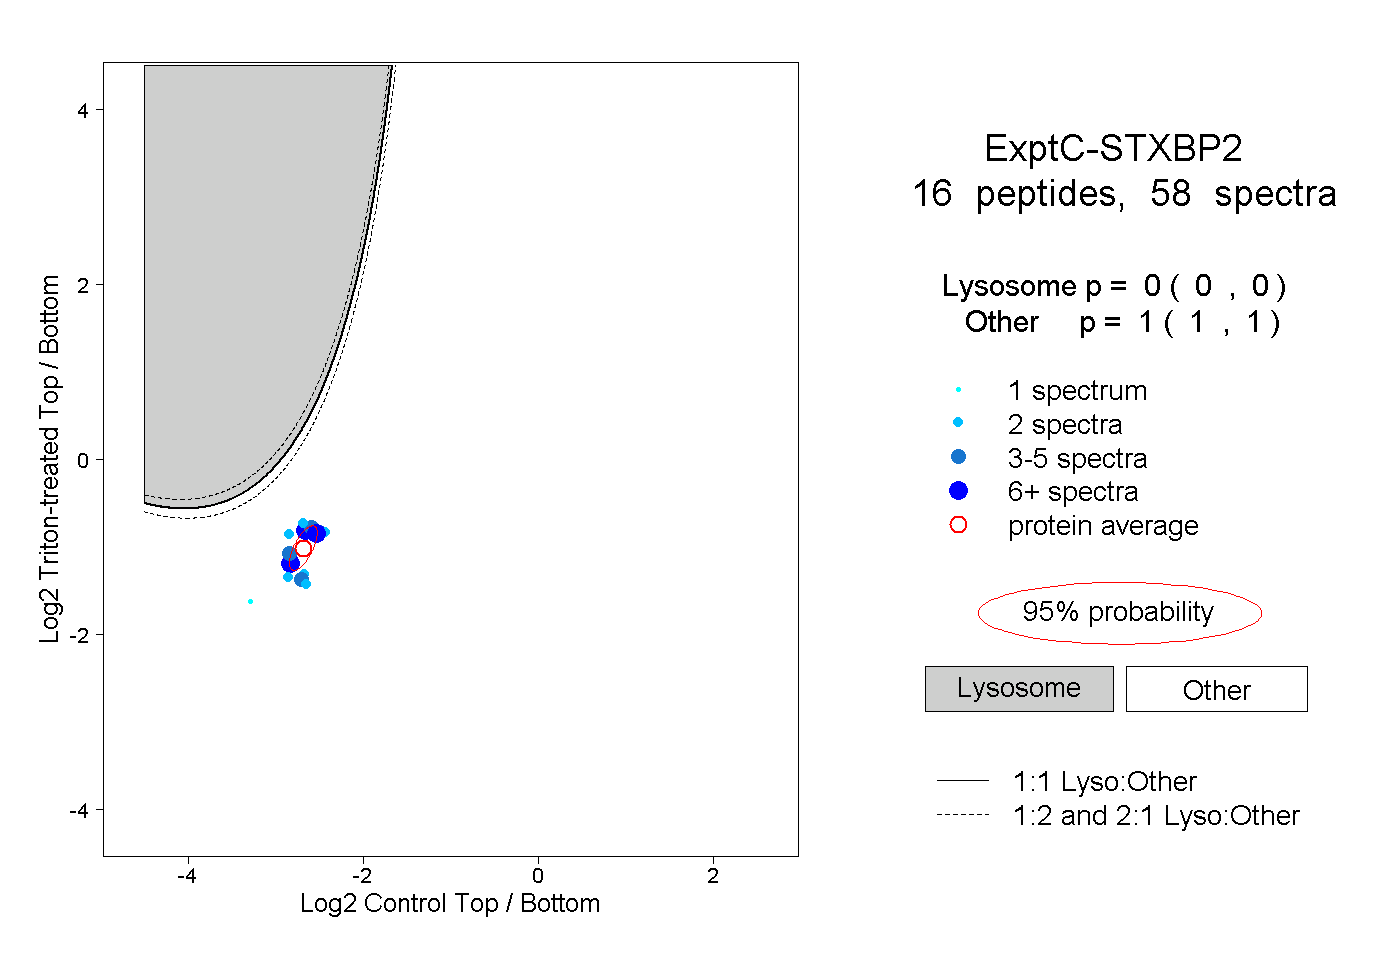
0.000 | 0.000
1.000 | 1.000
3peptides
spectra
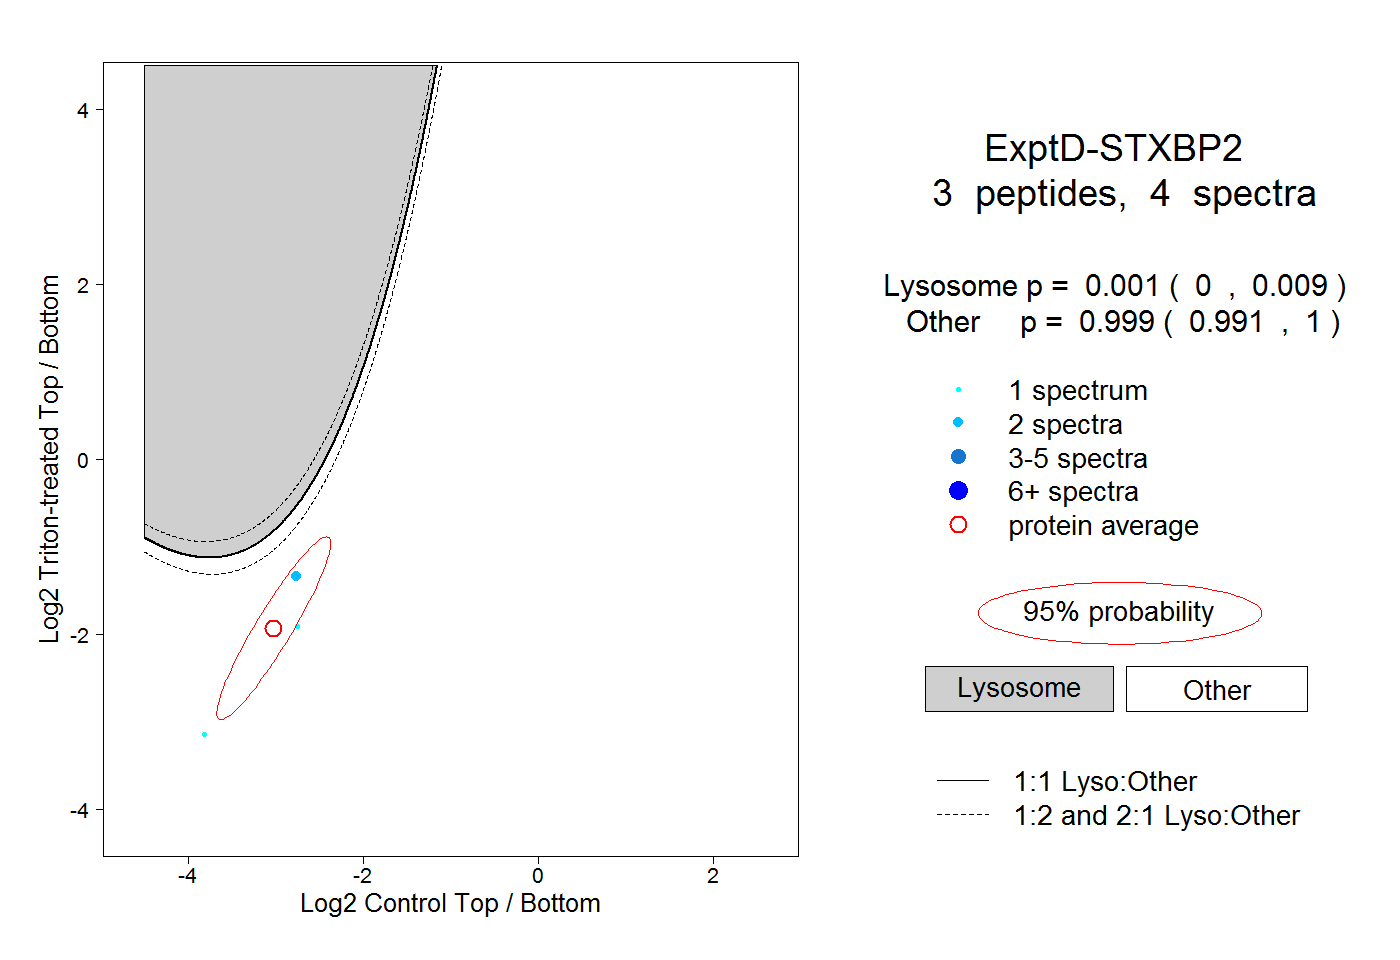
0.000 | 0.009
0.991 | 1.000