 11
11peptides
spectra

0.000 | 0.000
0.000 | 0.000
0.097 | 0.114
0.000 | 0.000
0.000 | 0.000
0.669 | 0.687
0.210 | 0.221
0.000 | 0.000
| Plot | Mito | Lyso | Perox | ER | Golgi | PM | Cytosol | Nucleus | |||||
| Expt A |
11 peptides |
22 spectra |
|
0.000 0.000 | 0.000 |
0.000 0.000 | 0.000 |
0.106 0.097 | 0.114 |
0.000 0.000 | 0.000 |
0.000 0.000 | 0.000 |
0.678 0.669 | 0.687 |
0.216 0.210 | 0.221 |
0.000 0.000 | 0.000 |
| 1 spectrum, NLEQLGGTVTNSAGSGTSSR | 0.000 | 0.010 | 0.066 | 0.000 | 0.000 | 0.736 | 0.187 | 0.000 | ||
| 1 spectrum, DLSHILK | 0.000 | 0.000 | 0.134 | 0.035 | 0.000 | 0.642 | 0.189 | 0.000 | ||
| 2 spectra, MEPTYQLSR | 0.000 | 0.061 | 0.038 | 0.000 | 0.000 | 0.718 | 0.182 | 0.000 | ||
| 2 spectra, YETTGLSESR | 0.000 | 0.000 | 0.006 | 0.000 | 0.000 | 0.774 | 0.220 | 0.000 | ||
| 4 spectra, AAYEVTR | 0.000 | 0.021 | 0.103 | 0.000 | 0.000 | 0.632 | 0.244 | 0.000 | ||
| 3 spectra, LIQHANVQSYSNLIR | 0.002 | 0.000 | 0.146 | 0.000 | 0.000 | 0.672 | 0.181 | 0.000 | ||
| 1 spectrum, SQLLIMDR | 0.000 | 0.000 | 0.196 | 0.000 | 0.000 | 0.672 | 0.082 | 0.050 | ||
| 1 spectrum, ILSGVIR | 0.000 | 0.115 | 0.085 | 0.000 | 0.000 | 0.428 | 0.371 | 0.000 | ||
| 1 spectrum, ADTPSLGEGPEK | 0.000 | 0.026 | 0.192 | 0.000 | 0.000 | 0.614 | 0.168 | 0.000 | ||
| 1 spectrum, LCGVEQDLAMGSDAEGEK | 0.000 | 0.000 | 0.000 | 0.166 | 0.000 | 0.549 | 0.285 | 0.000 | ||
| 5 spectra, DVMEDVVEDR | 0.000 | 0.162 | 0.000 | 0.000 | 0.009 | 0.578 | 0.251 | 0.000 |
| Plot | Mito | Lyso or Perox | ER | Golgi | PM | Cytosol | Nucleus | ||||||
| Expt B |
3 peptides |
3 spectra |
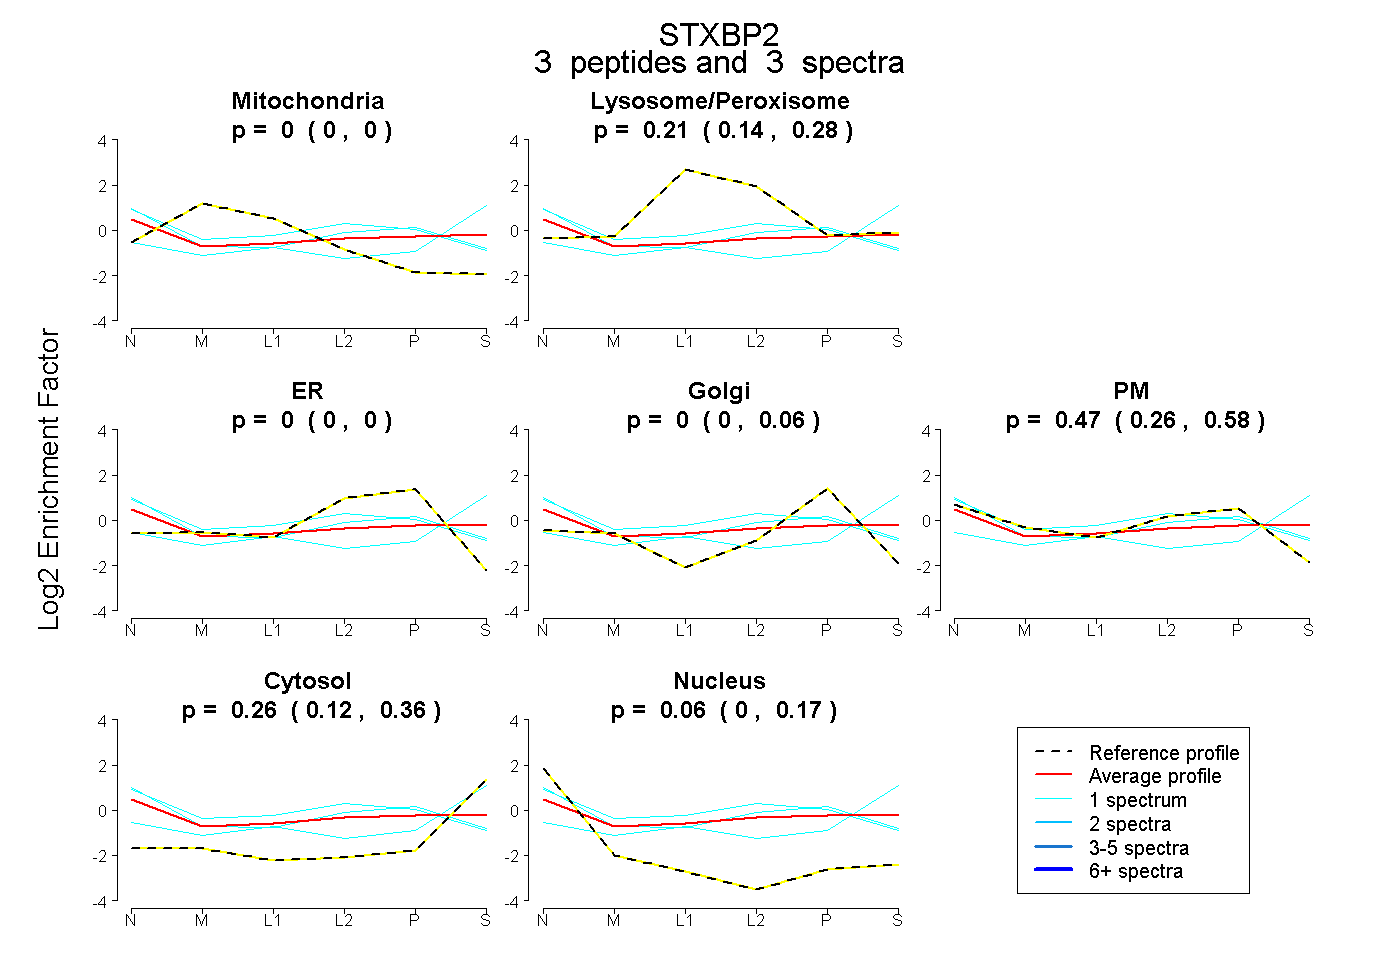 |
0.000 0.000 | 0.000 |
0.209 0.139 | 0.285 |
0.000 0.000 | 0.000 |
0.000 0.000 | 0.064 |
0.466 0.259 | 0.580 |
0.264 0.119 | 0.361 |
0.061 0.000 | 0.167 |
|||
| Plot | Lyso | Other | |||||||||||
| Expt C |
16 peptides |
58 spectra |
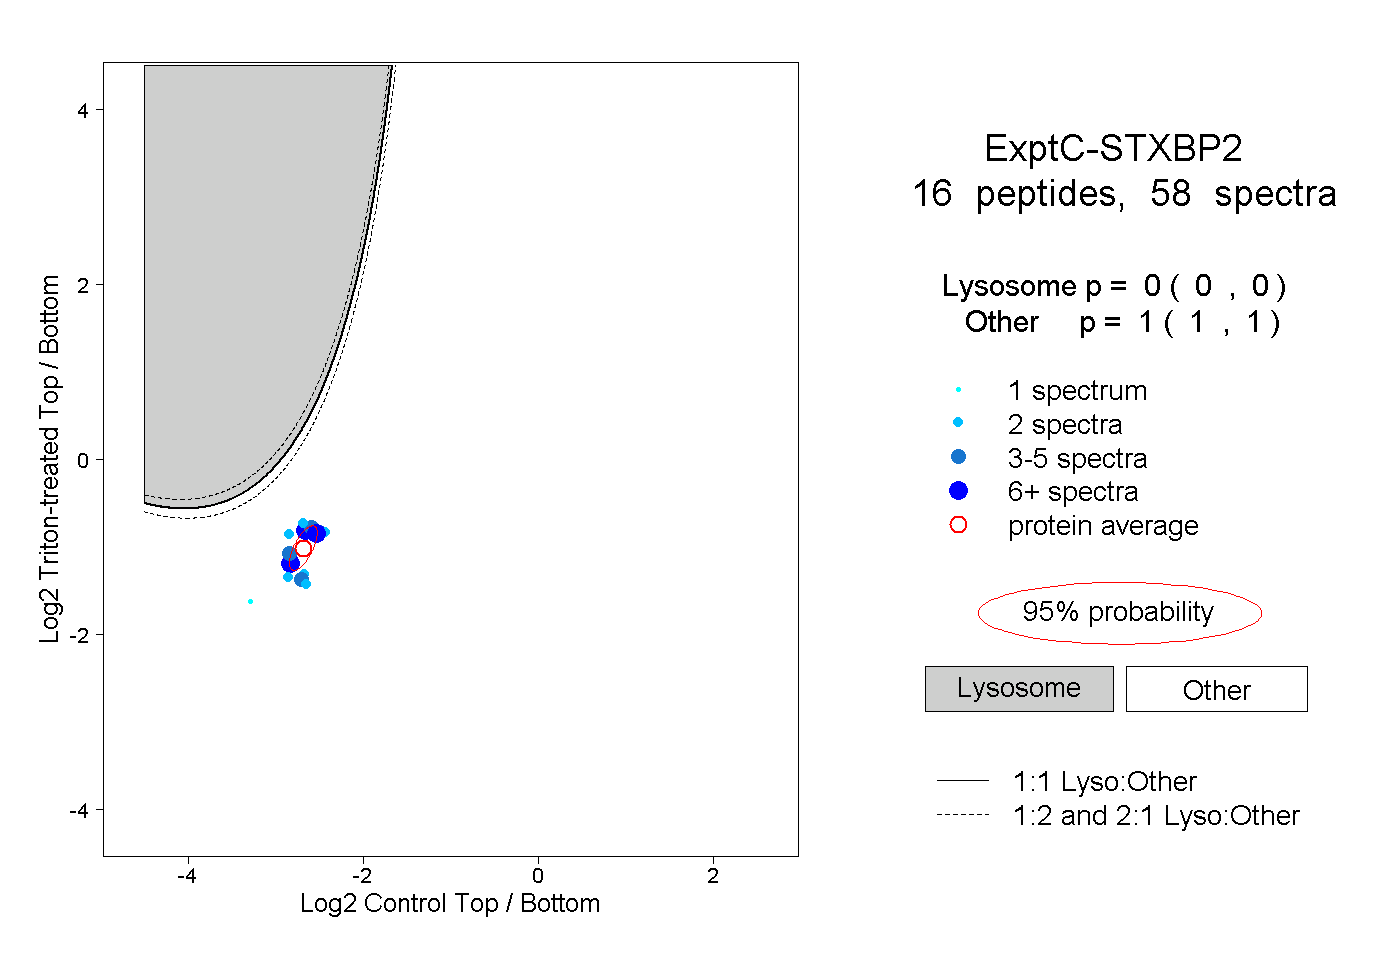 |
0.000 0.000 | 0.000 |
1.000 1.000 | 1.000 |
||||||||
| Plot | Lyso | Other | |||||||||||
| Expt D |
3 peptides |
4 spectra |
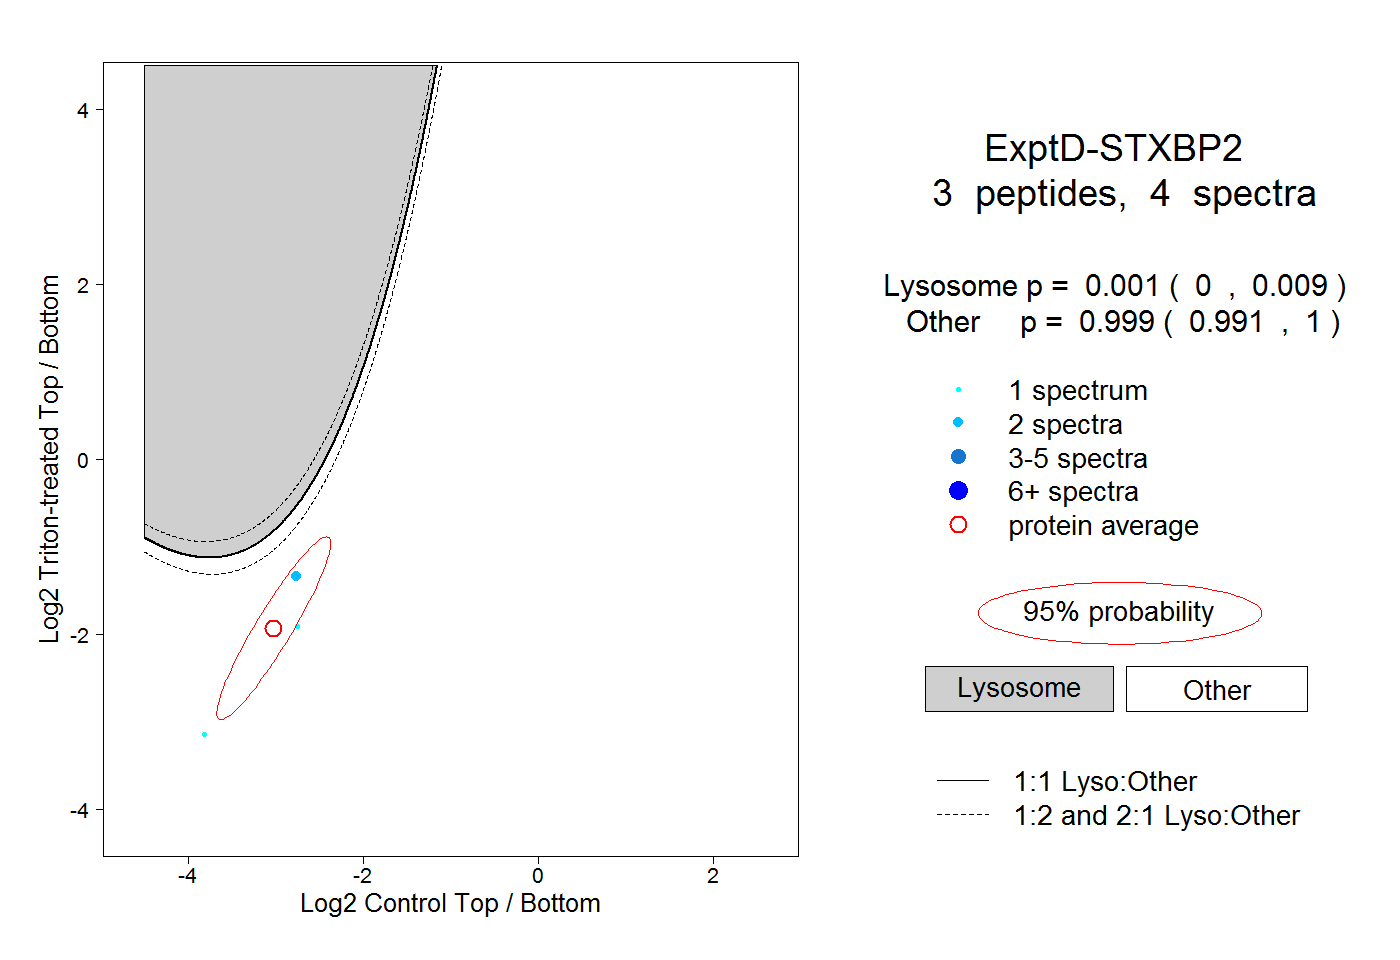 |
0.001 0.000 | 0.009 |
0.999 0.991 | 1.000 |