 12
12peptides
spectra
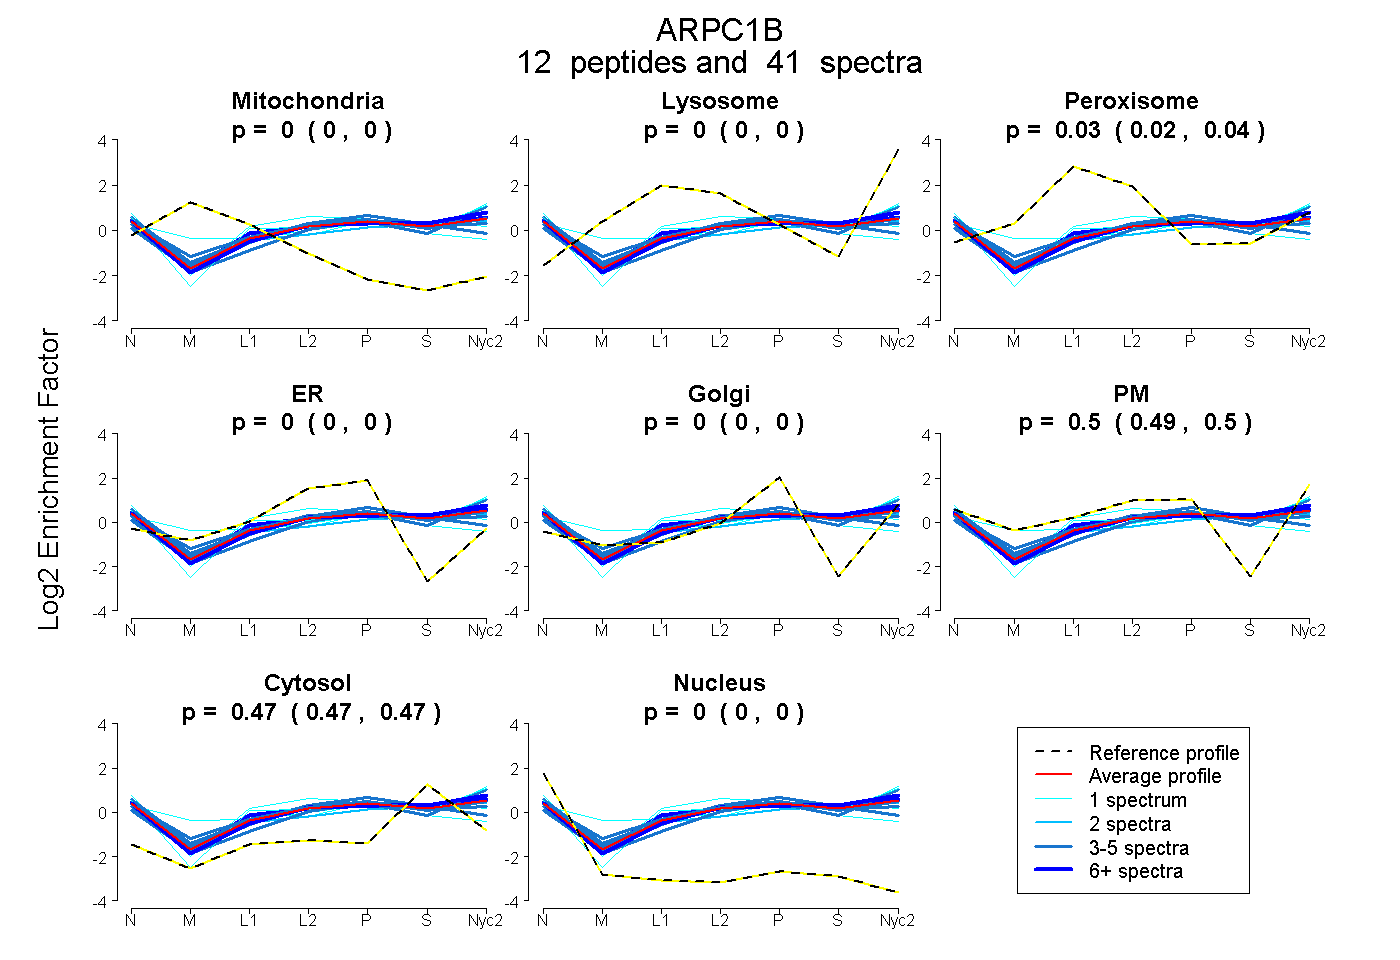
0.000 | 0.000
0.000 | 0.000
0.025 | 0.035
0.000 | 0.000
0.000 | 0.000
0.494 | 0.504
0.466 | 0.473
0.000 | 0.000
3peptides
spectra
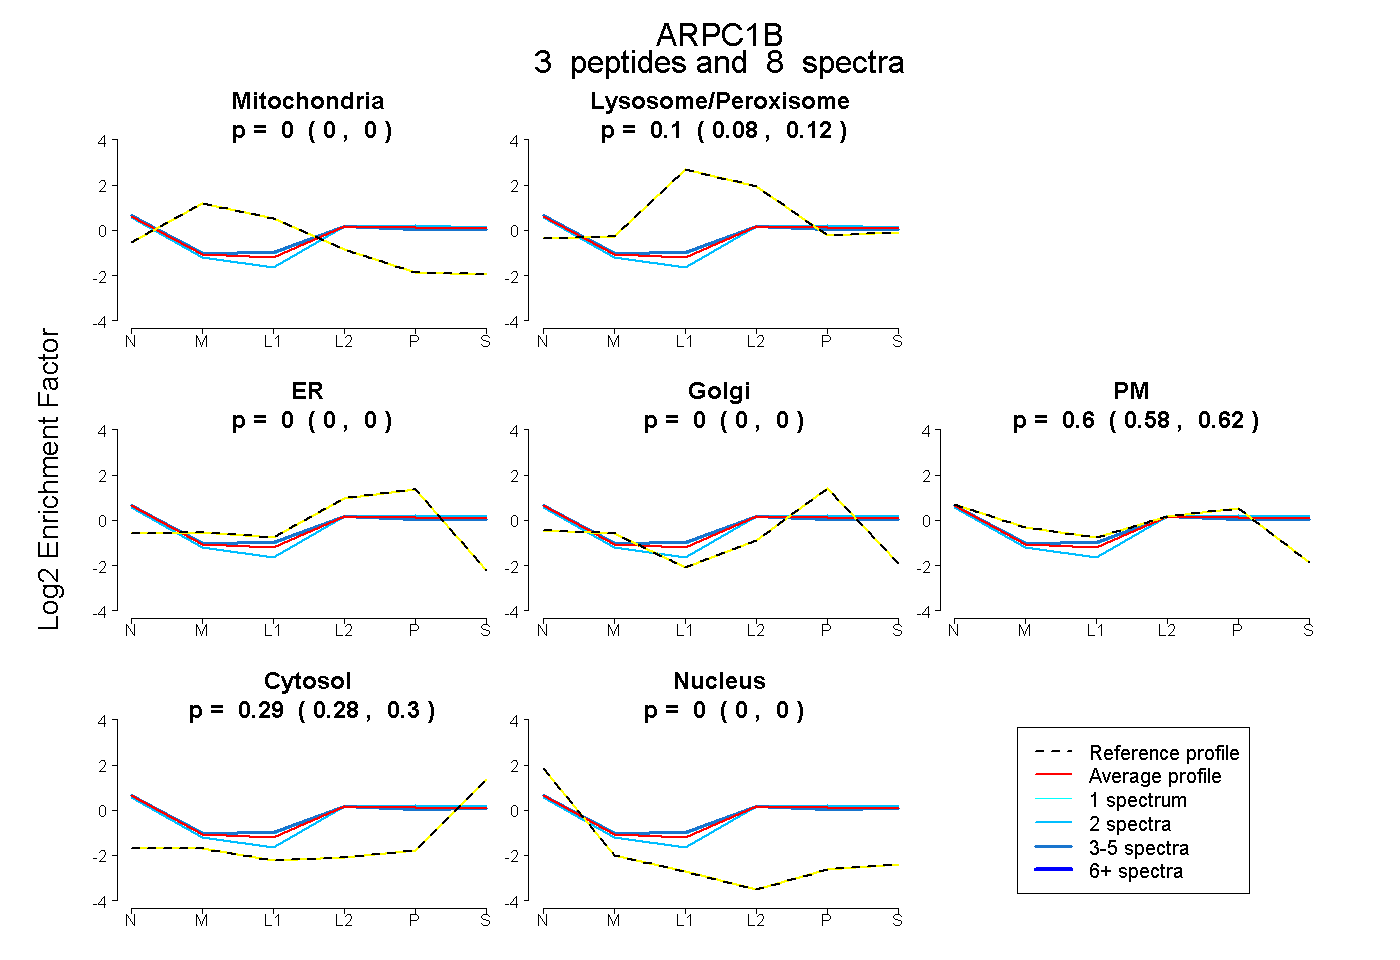
0.000 | 0.000
0.078 | 0.124
0.000 | 0.000
0.000 | 0.000
0.584 | 0.619
0.285 | 0.301
0.000 | 0.000
13peptides
spectra
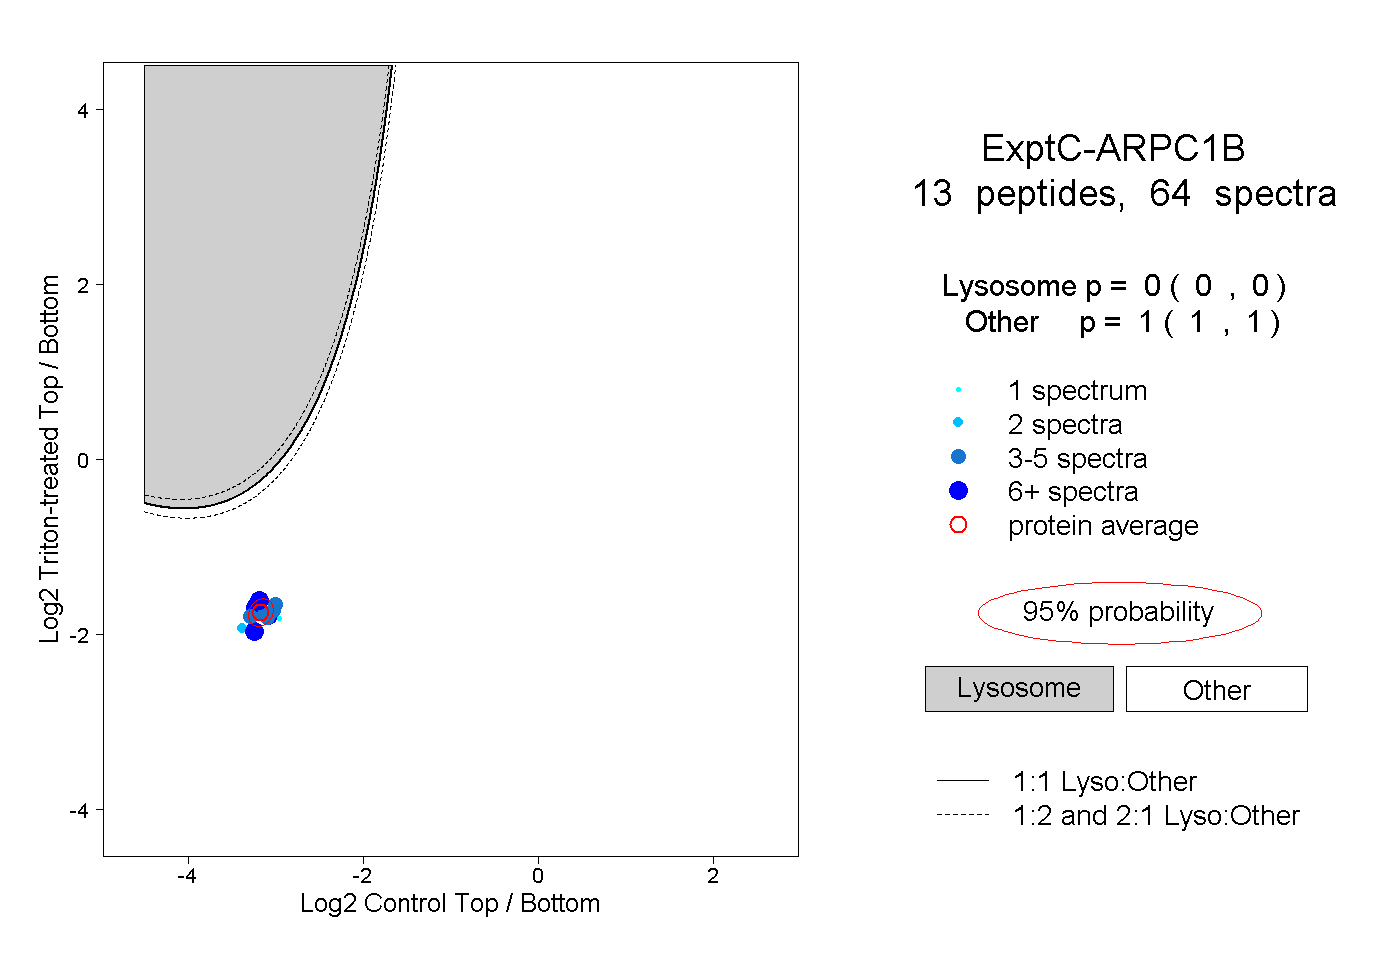
0.000 | 0.000
1.000 | 1.000
6peptides
spectra
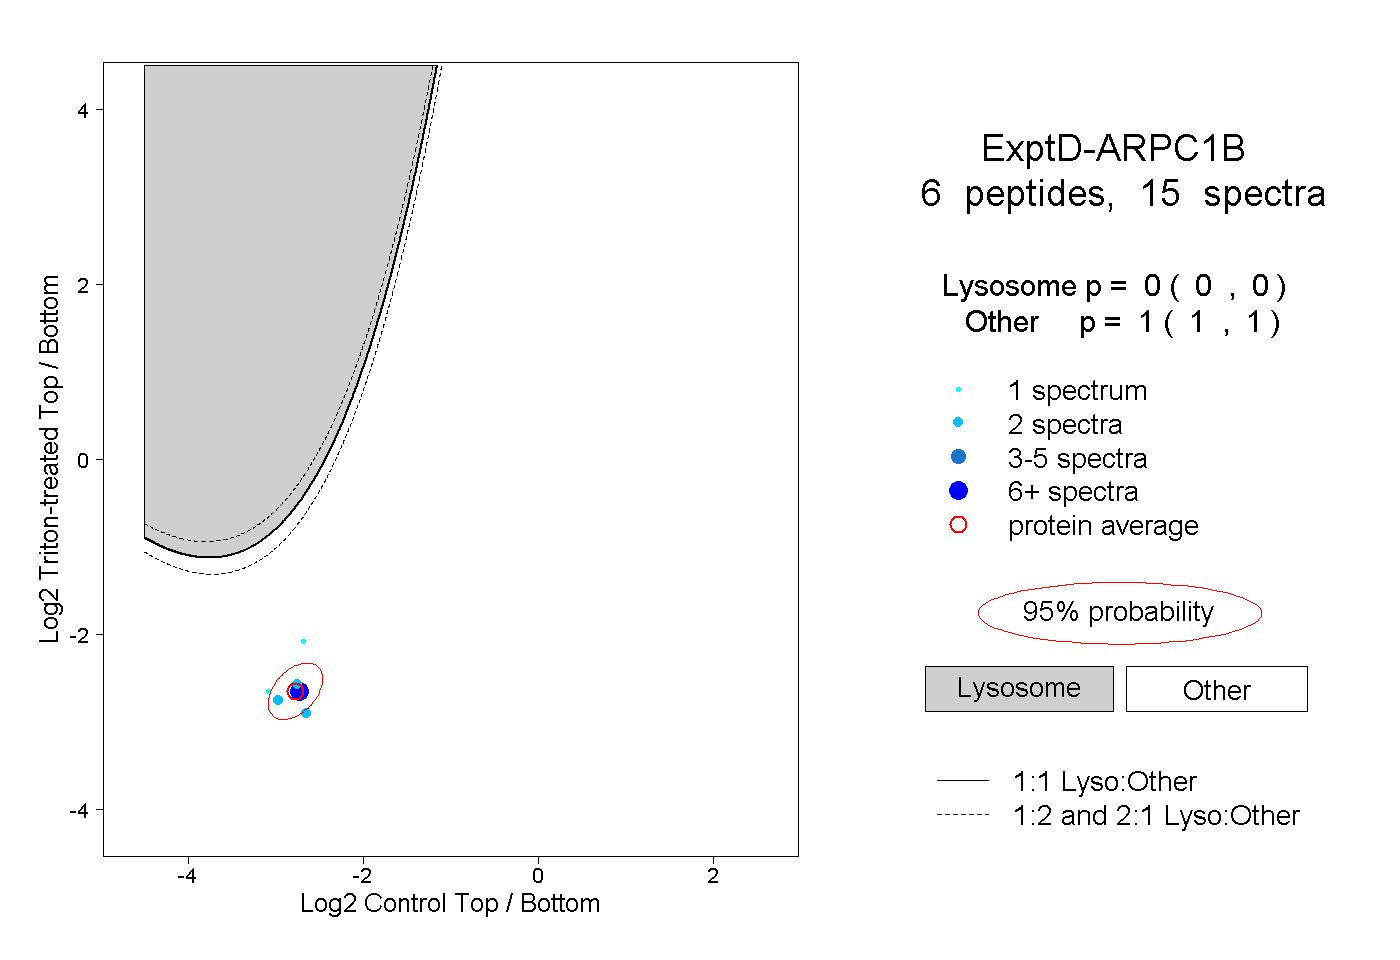
0.000 | 0.000
1.000 | 1.000