 12
12peptides
spectra
0.000 | 0.000
0.000 | 0.000
0.025 | 0.035
0.000 | 0.000
0.000 | 0.000
0.494 | 0.504
0.466 | 0.473
0.000 | 0.000
| Plot | Mito | Lyso | Perox | ER | Golgi | PM | Cytosol | Nucleus | |||||
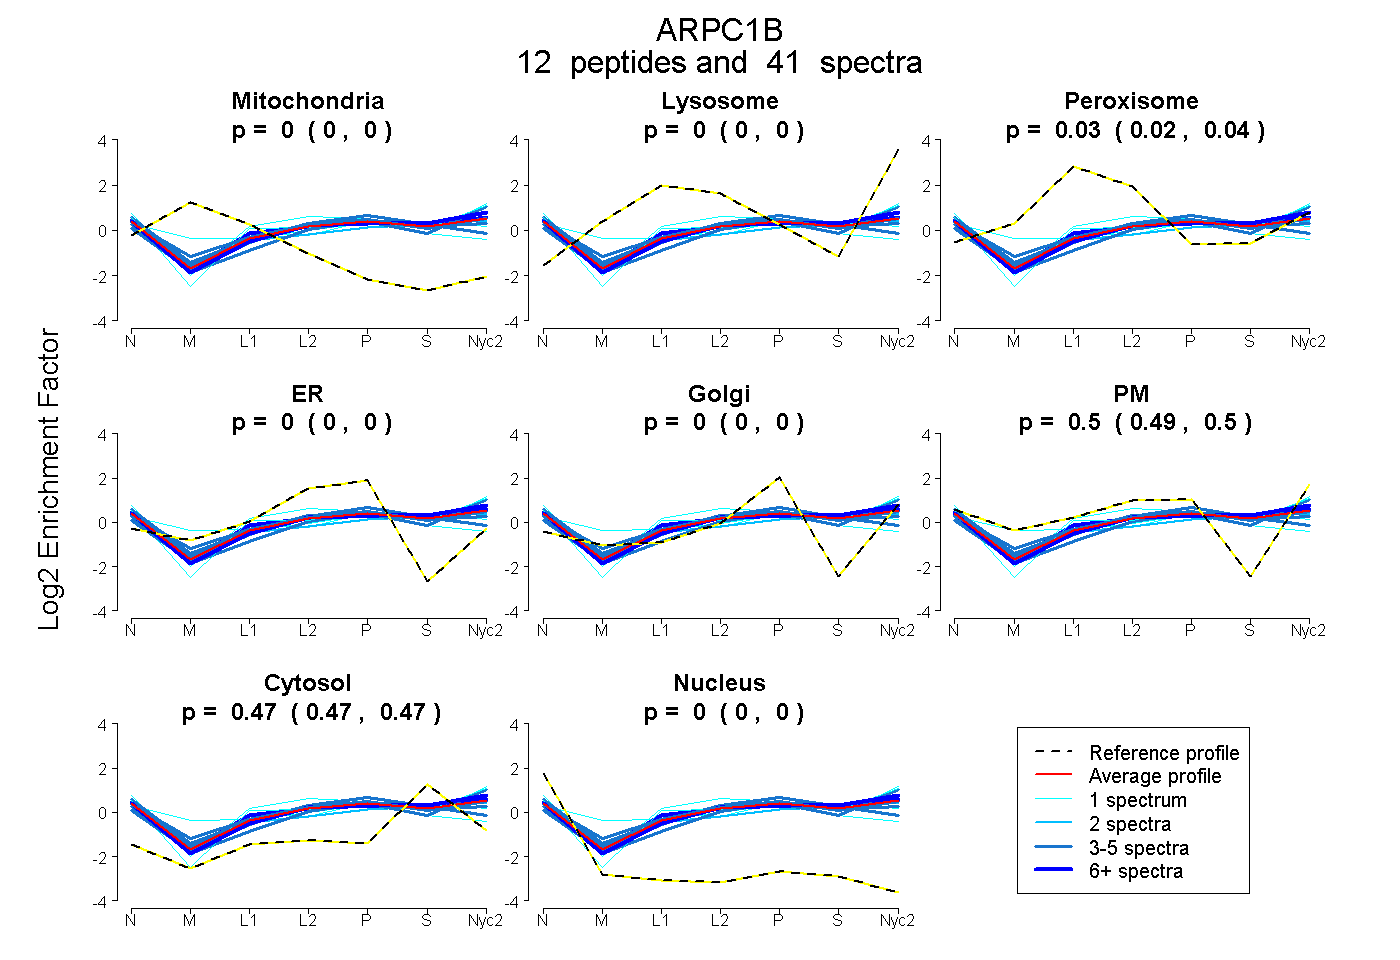
| Expt A |
12 peptides |
41 spectra |
|
0.000 0.000 | 0.000 |
0.000 0.000 | 0.000 |
0.030 0.025 | 0.035 |
0.000 0.000 | 0.000 |
0.000 0.000 | 0.000 |
0.500 0.494 | 0.504 |
0.470 0.466 | 0.473 |
0.000 0.000 | 0.000 |
| 10 spectra, TWKPTLVILR | 0.000 | 0.000 | 0.007 | 0.000 | 0.000 | 0.507 | 0.486 | 0.000 | ||
| 3 spectra, IFSAYIK | 0.000 | 0.000 | 0.008 | 0.000 | 0.000 | 0.605 | 0.387 | 0.000 | ||
| 1 spectrum, NSVSQISVLSGGK | 0.000 | 0.000 | 0.005 | 0.000 | 0.000 | 0.562 | 0.432 | 0.000 | ||
| 3 spectra, WAPNENK | 0.000 | 0.000 | 0.072 | 0.000 | 0.000 | 0.506 | 0.422 | 0.000 | ||
| 4 spectra, TQIAICPNNHEVHIYEK | 0.000 | 0.000 | 0.018 | 0.274 | 0.000 | 0.209 | 0.500 | 0.000 | ||
| 1 spectrum, CSQFCTTGMDGGMSIWDVK | 0.108 | 0.000 | 0.086 | 0.166 | 0.000 | 0.263 | 0.376 | 0.000 | ||
| 1 spectrum, AYHSFLVEPISCHAWNK | 0.000 | 0.000 | 0.083 | 0.032 | 0.000 | 0.370 | 0.515 | 0.000 | ||
| 4 spectra, IVTCGTDR | 0.000 | 0.000 | 0.045 | 0.037 | 0.000 | 0.453 | 0.465 | 0.000 | ||
| 1 spectrum, ASSEGGAATGAGLDSLHK | 0.000 | 0.000 | 0.082 | 0.000 | 0.000 | 0.581 | 0.337 | 0.000 | ||
| 2 spectra, EVEERPAPTPWGSK | 0.000 | 0.000 | 0.000 | 0.000 | 0.000 | 0.471 | 0.529 | 0.000 | ||
| 4 spectra, NAYVWTLK | 0.000 | 0.000 | 0.000 | 0.000 | 0.000 | 0.490 | 0.510 | 0.000 | ||
| 7 spectra, FAVGSGSR | 0.000 | 0.000 | 0.079 | 0.000 | 0.000 | 0.462 | 0.460 | 0.000 |
| Plot | Mito | Lyso or Perox | ER | Golgi | PM | Cytosol | Nucleus | ||||||
| Expt B |
3 peptides |
8 spectra |
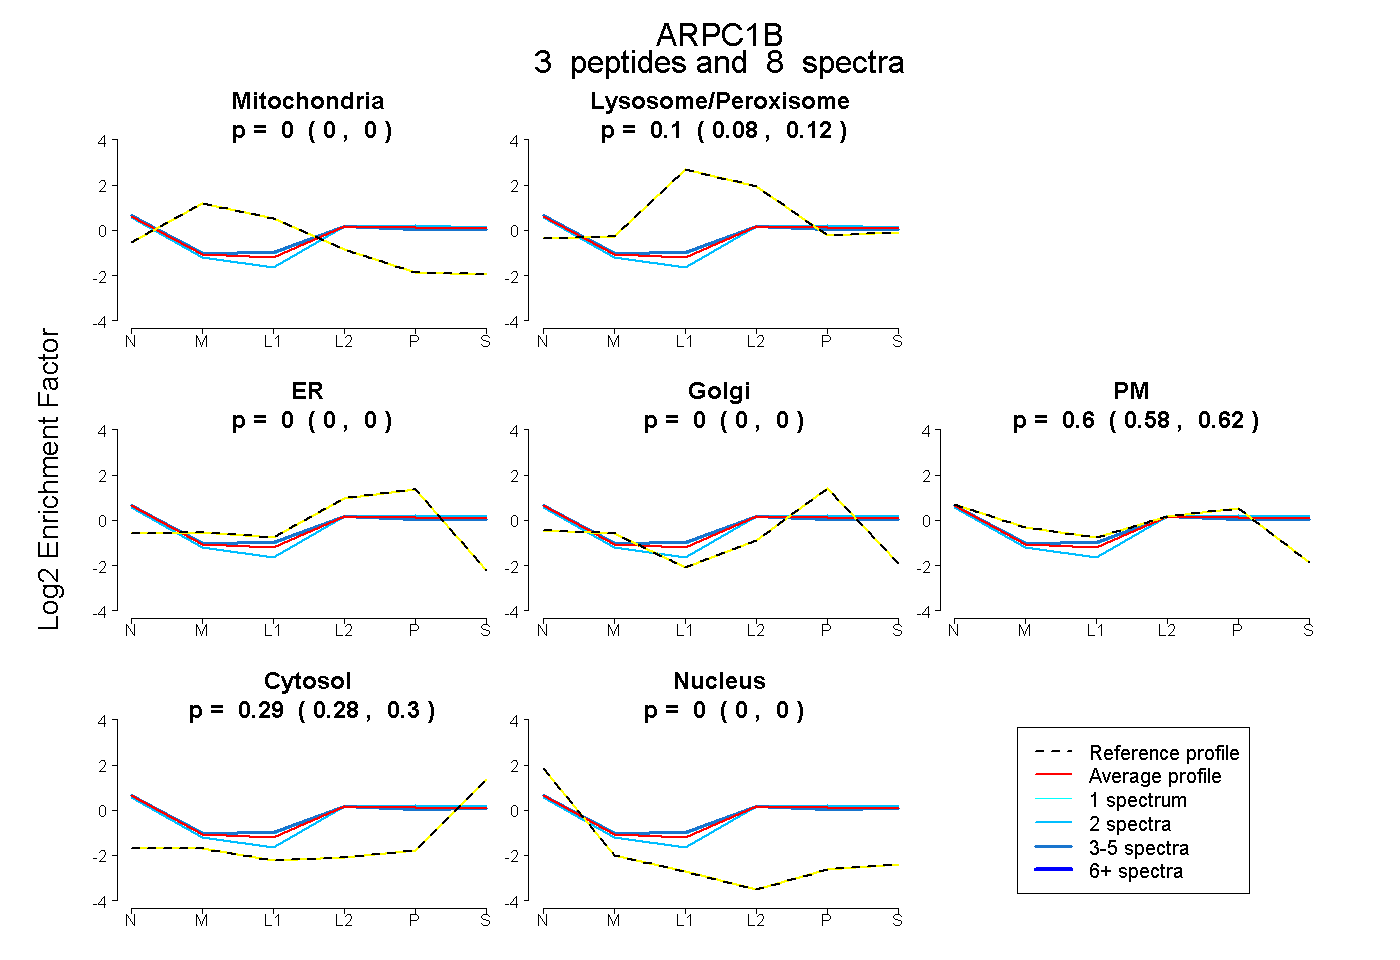 |
0.000 0.000 | 0.000 |
0.104 0.078 | 0.124 |
0.000 0.000 | 0.000 |
0.000 0.000 | 0.000 |
0.602 0.584 | 0.619 |
0.294 0.285 | 0.301 |
0.000 0.000 | 0.000 |
|||
| Plot | Lyso | Other | |||||||||||
| Expt C |
13 peptides |
64 spectra |
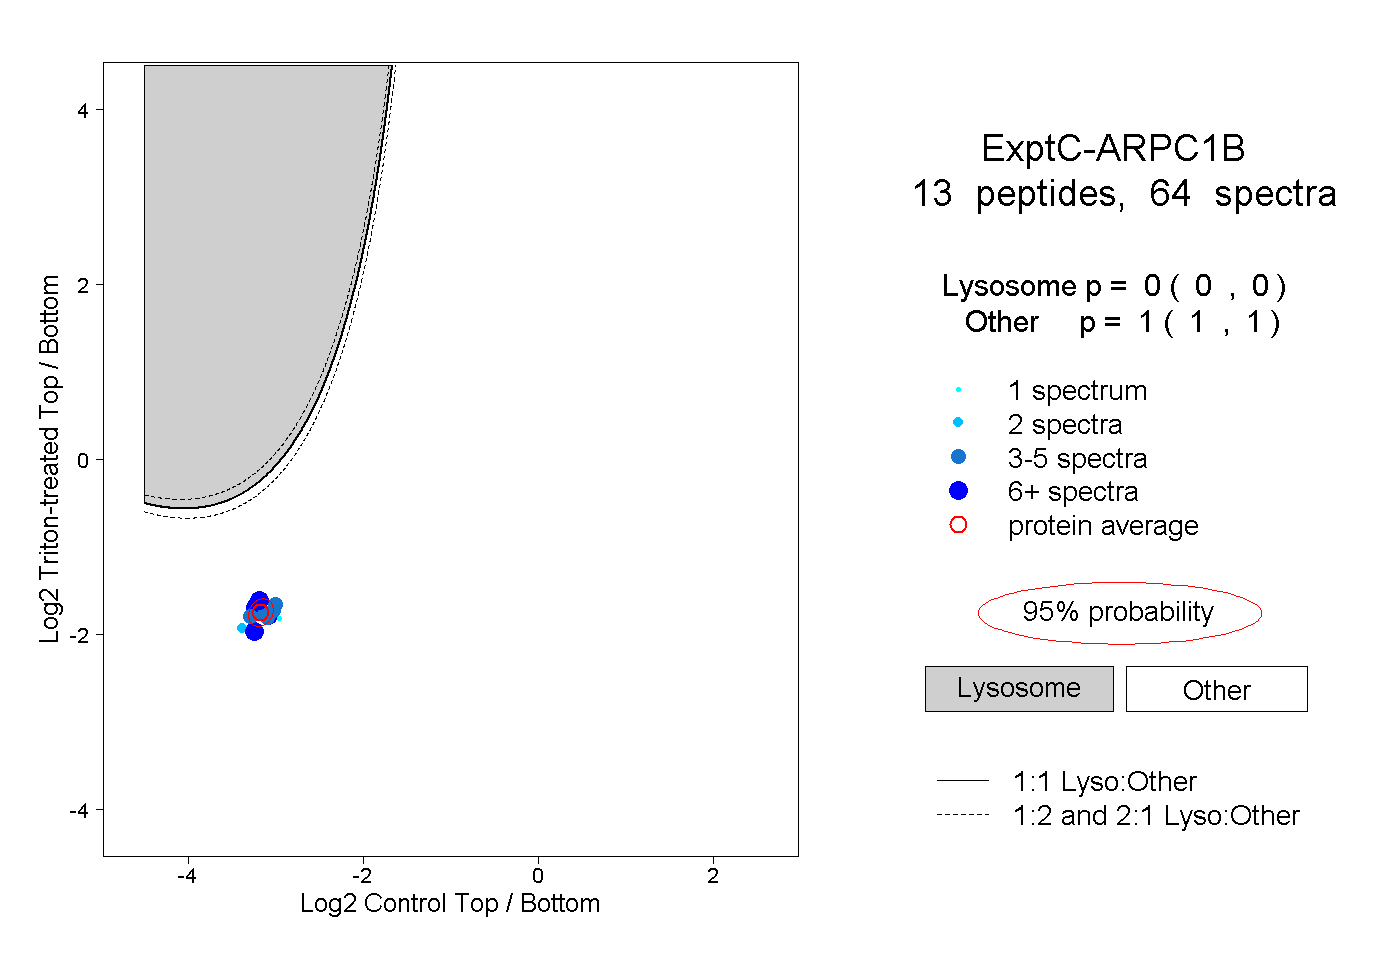 |
0.000 0.000 | 0.000 |
1.000 1.000 | 1.000 |
||||||||
| Plot | Lyso | Other | |||||||||||
| Expt D |
6 peptides |
15 spectra |
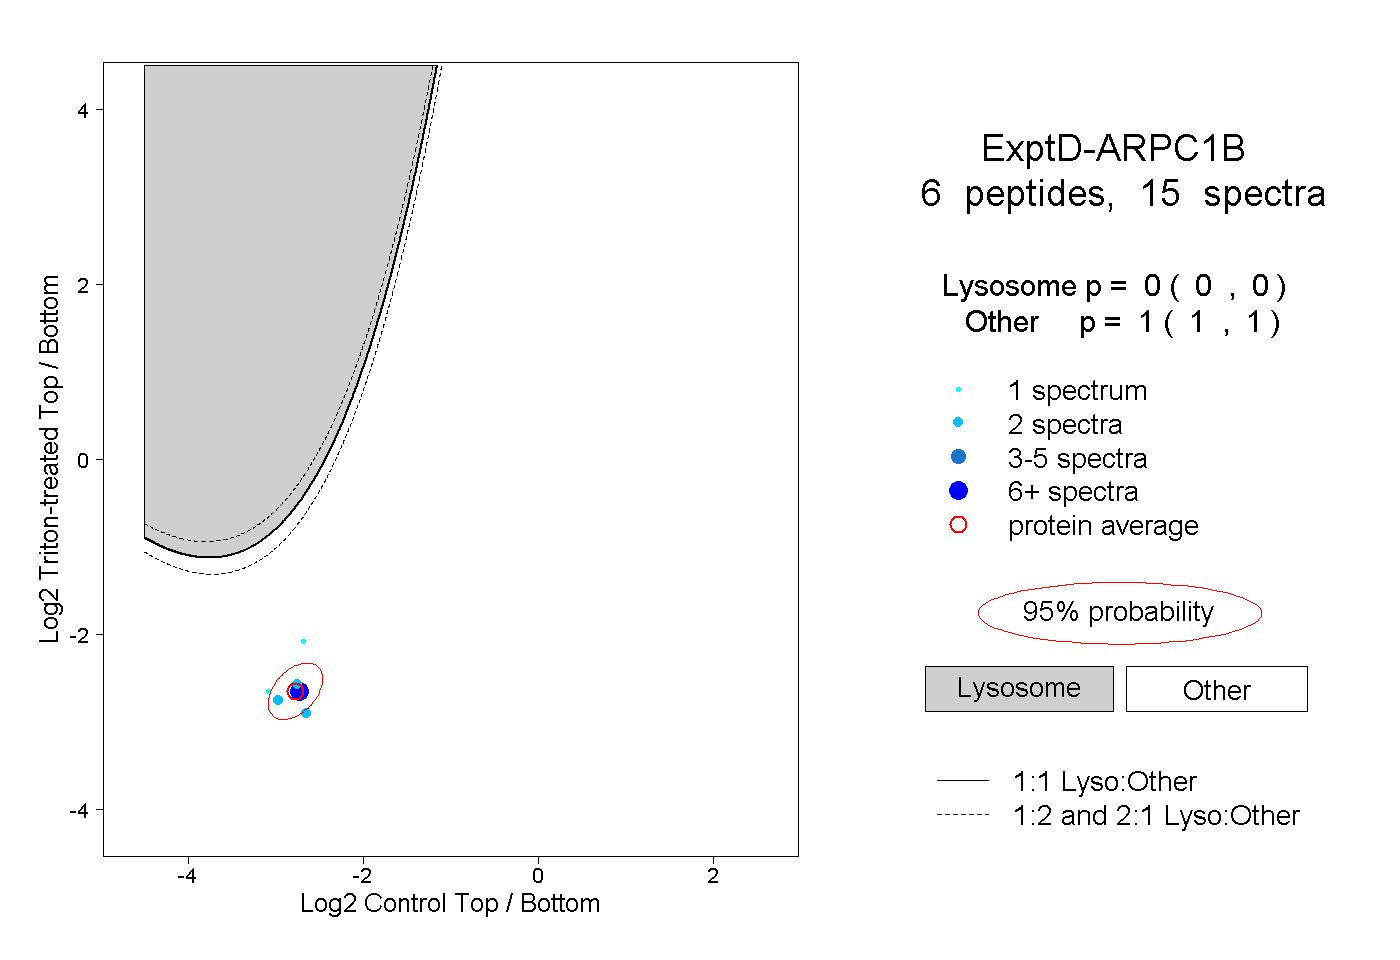 |
0.000 0.000 | 0.000 |
1.000 1.000 | 1.000 |