 4
4peptides
spectra
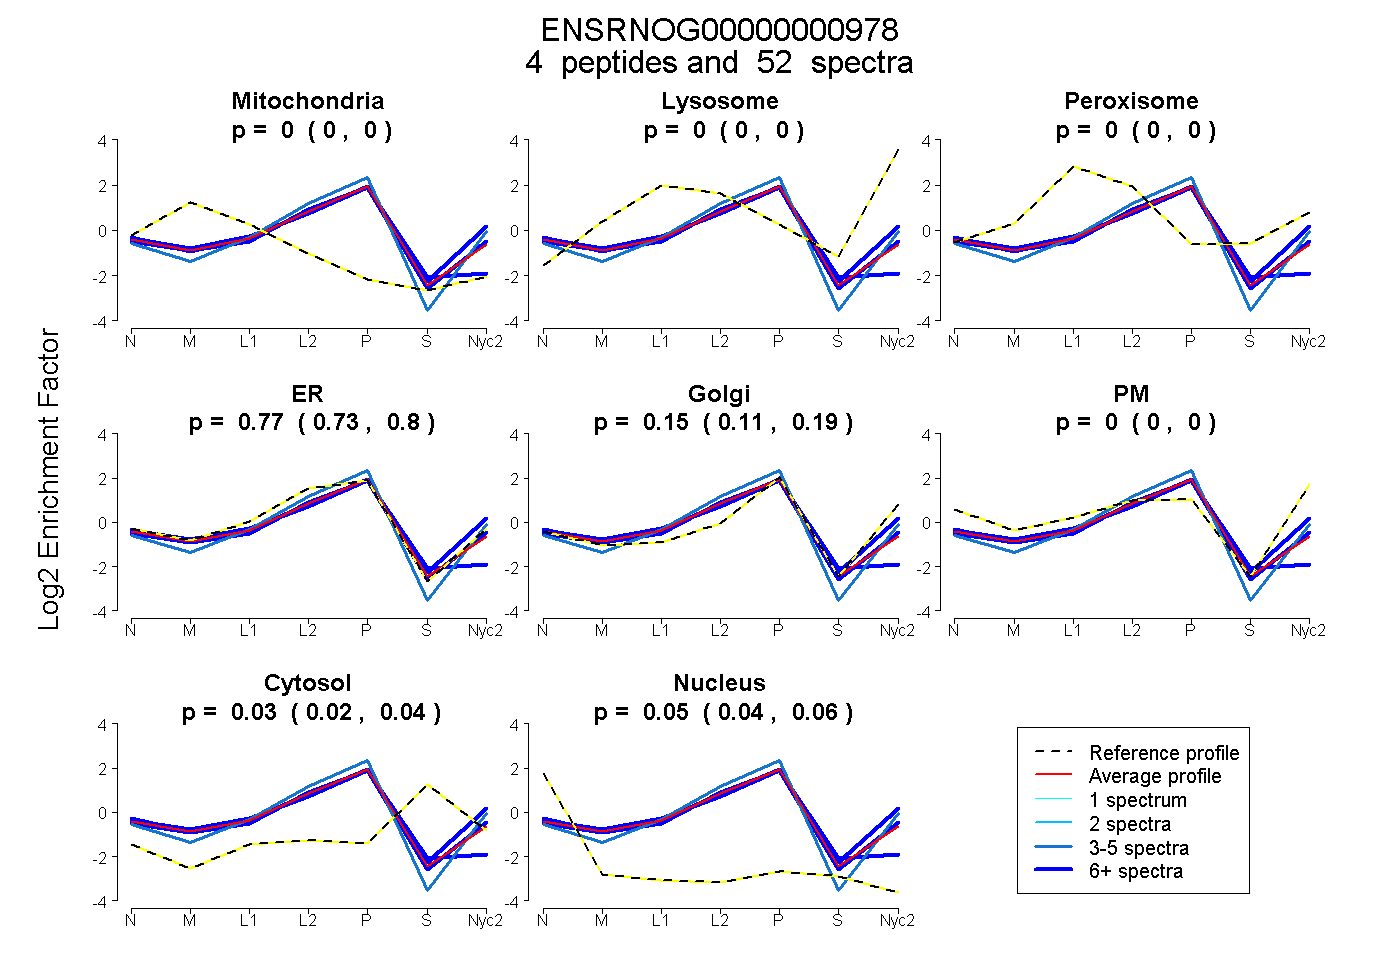
0.000 | 0.000
0.000 | 0.000
0.000 | 0.000
0.735 | 0.798
0.106 | 0.190
0.000 | 0.000
0.016 | 0.037
0.038 | 0.059
2peptides
spectra
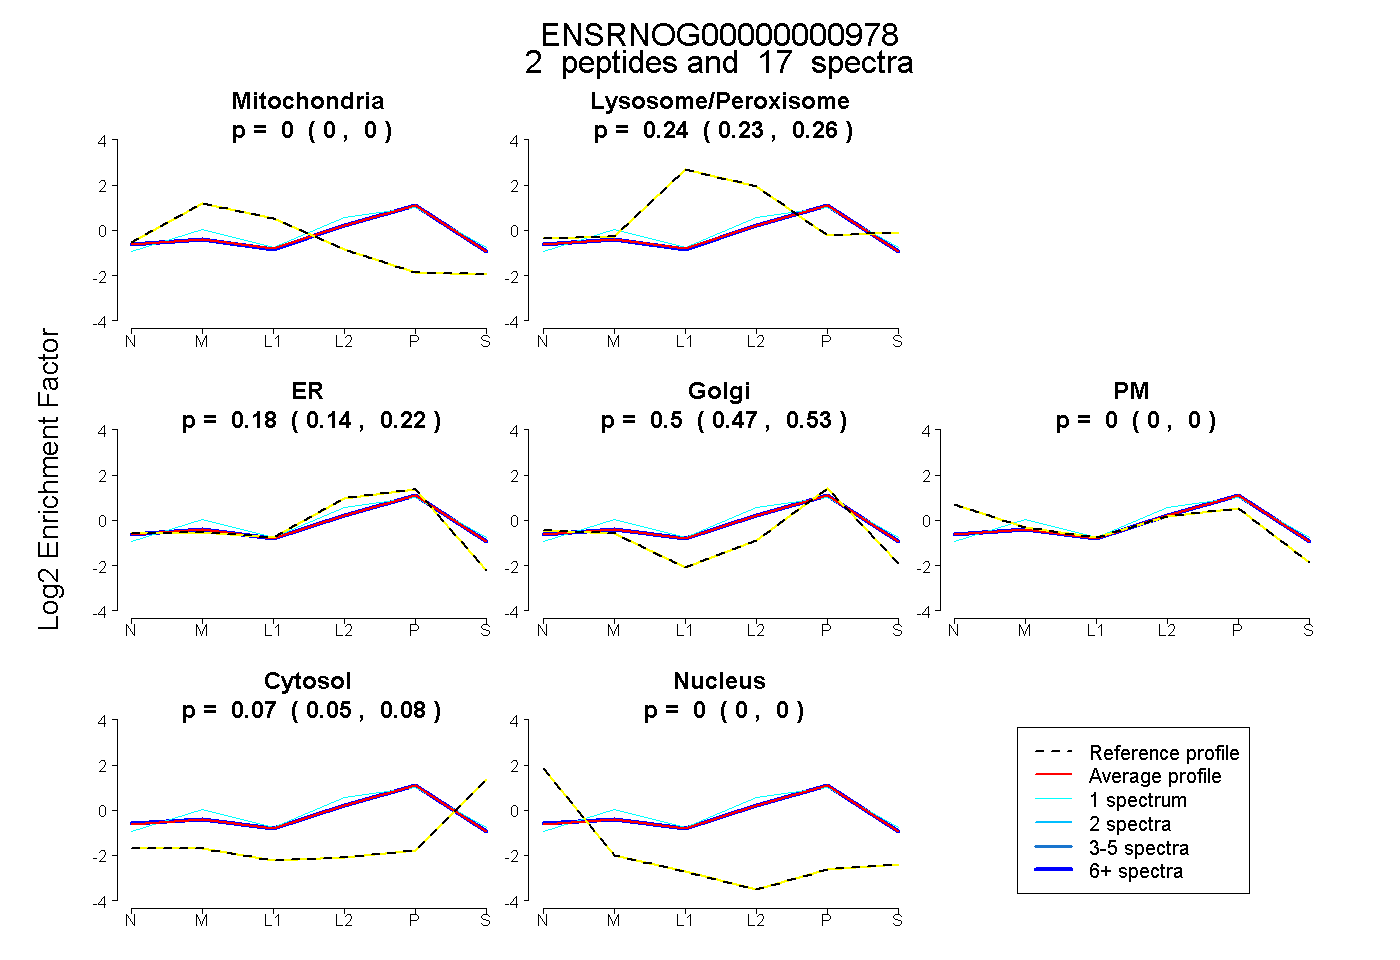
0.000 | 0.000
0.227 | 0.259
0.145 | 0.217
0.470 | 0.533
0.000 | 0.000
0.054 | 0.079
0.000 | 0.000
5peptides
spectra
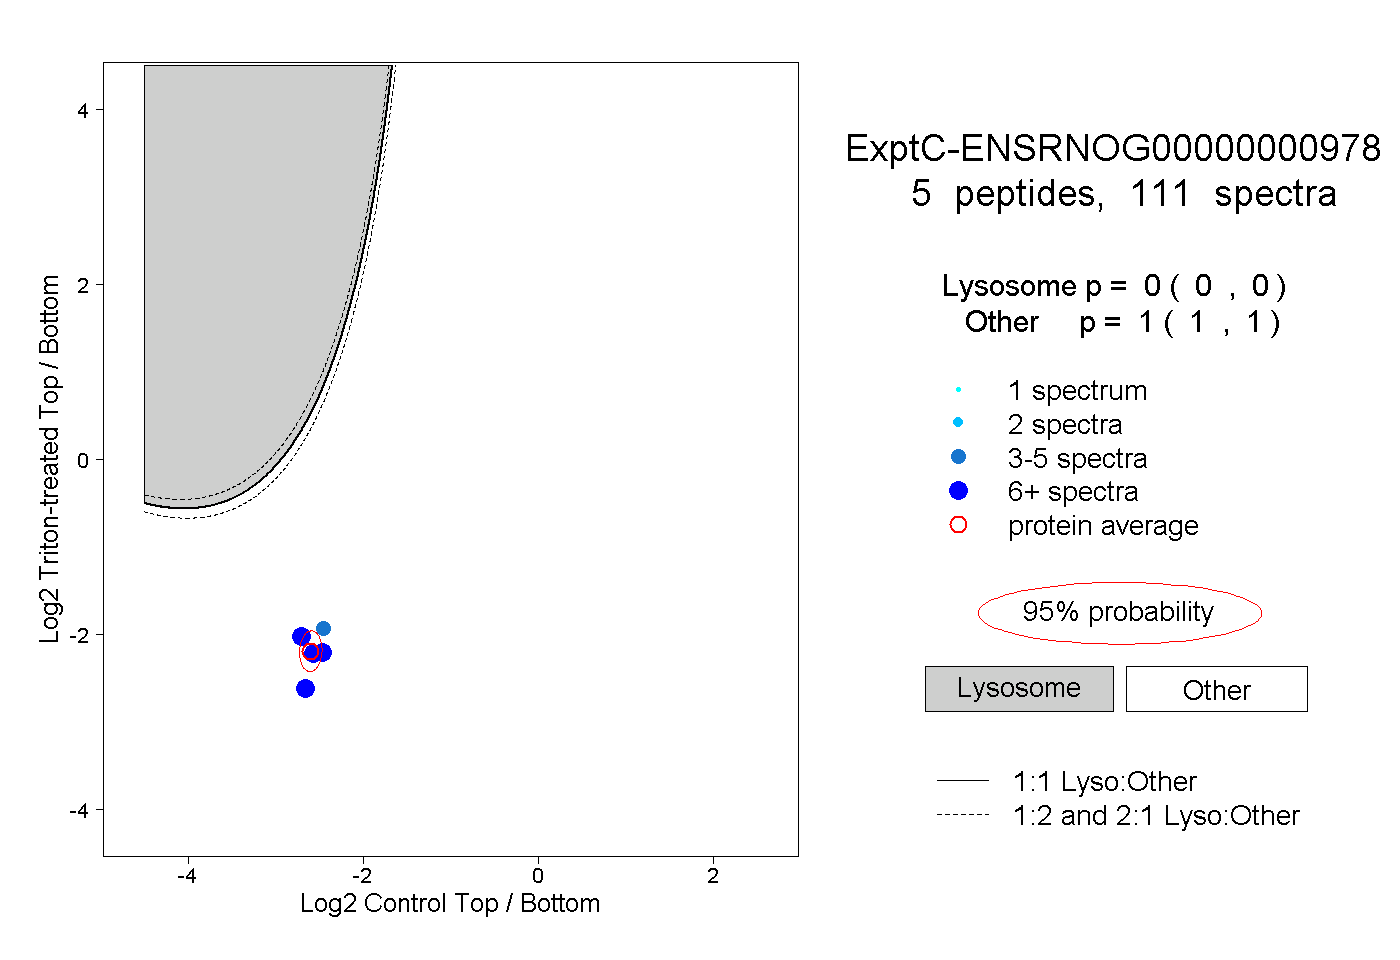
0.000 | 0.000
1.000 | 1.000
3peptides
spectra
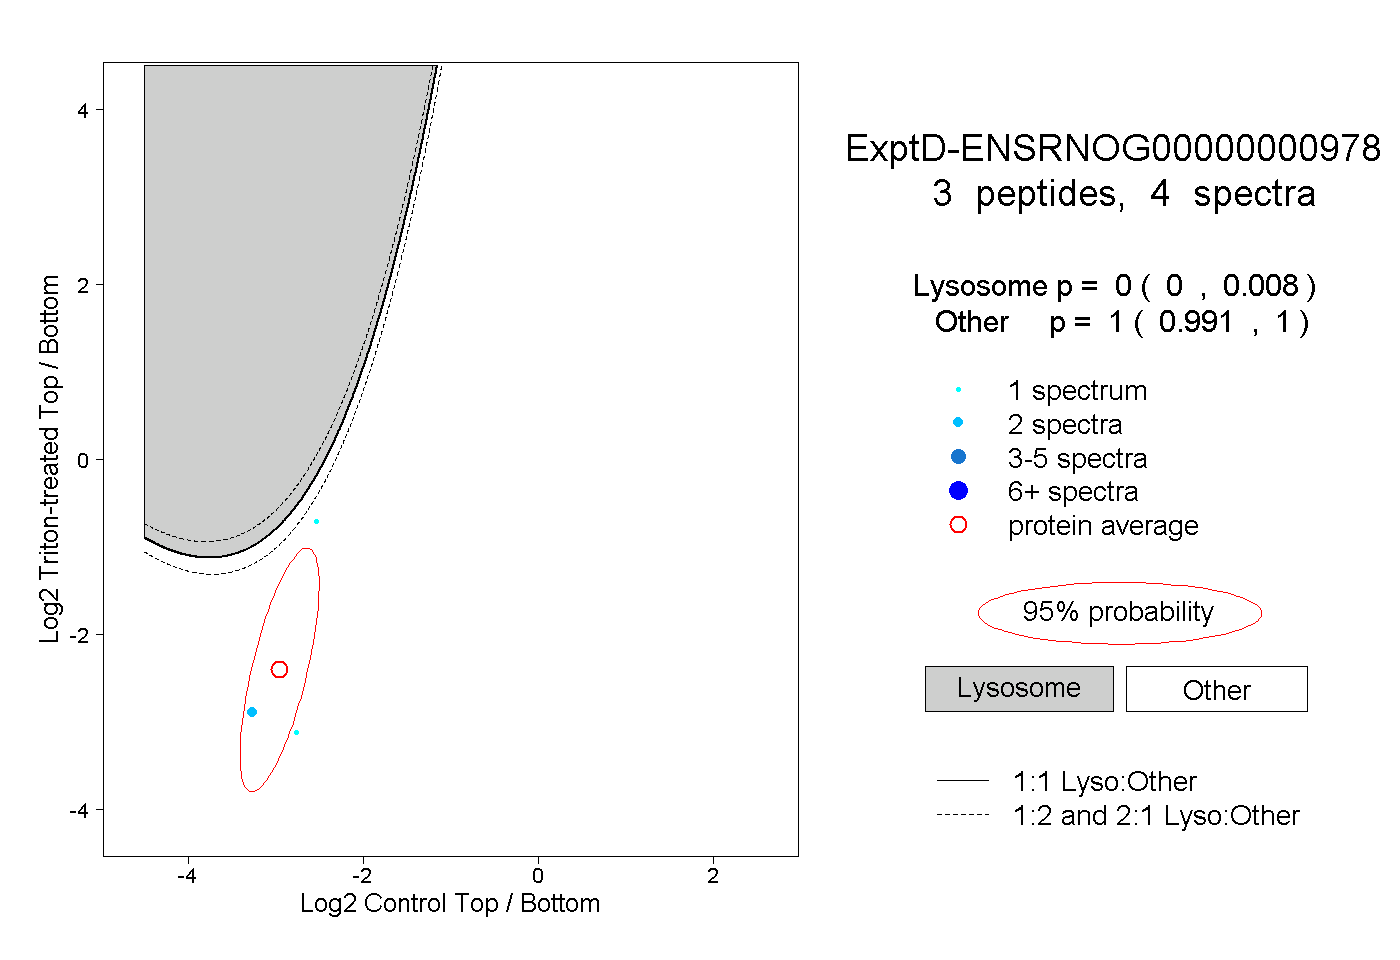
0.000 | 0.008
0.991 | 1.000