ENSRNOG00000000978
[ENSRNOP00000001291]
Main page
| | | Plot |
Mito |
Lyso |
|
Perox |
ER |
Golgi |
PM |
Cytosol |
Nucleus |
|
| Expt A |
 4
4
peptides |
52
spectra |
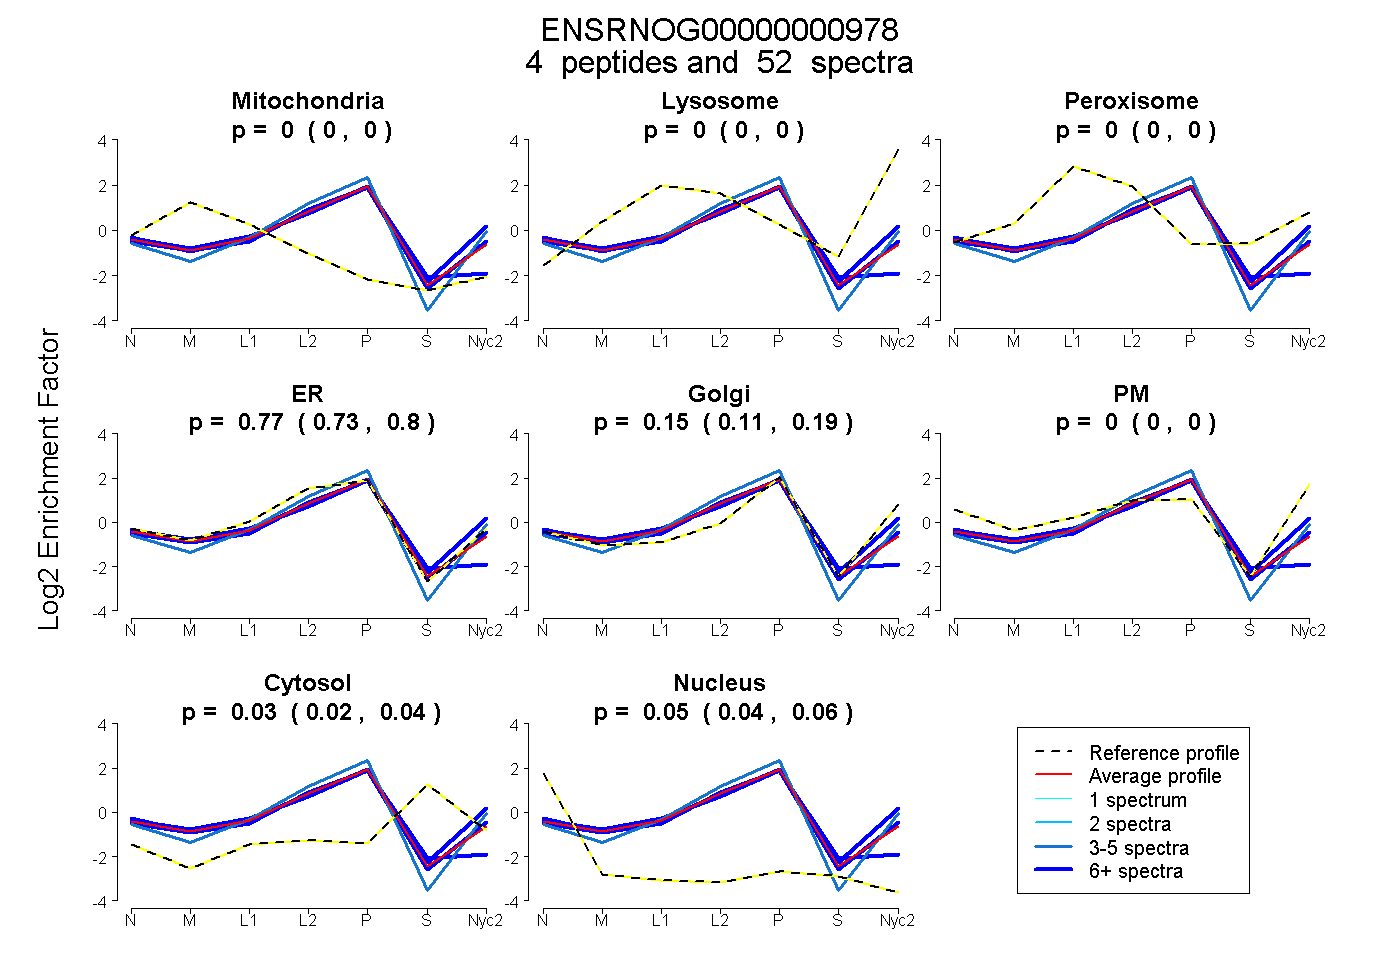 |
0.000
0.000 | 0.000 |
0.000
0.000 | 0.000 |
|
0.000
0.000 | 0.000 |
0.770
0.735 | 0.798 |
0.153
0.106 | 0.190 |
0.000
0.000 | 0.000 |
0.027
0.016 | 0.037 |
0.050
0.038 | 0.059 |
|
| | | Plot |
Mito |
|
Lyso or Perox |
|
ER |
Golgi |
PM |
Cytosol |
Nucleus |
|
| Expt B |
2
peptides |
17
spectra |
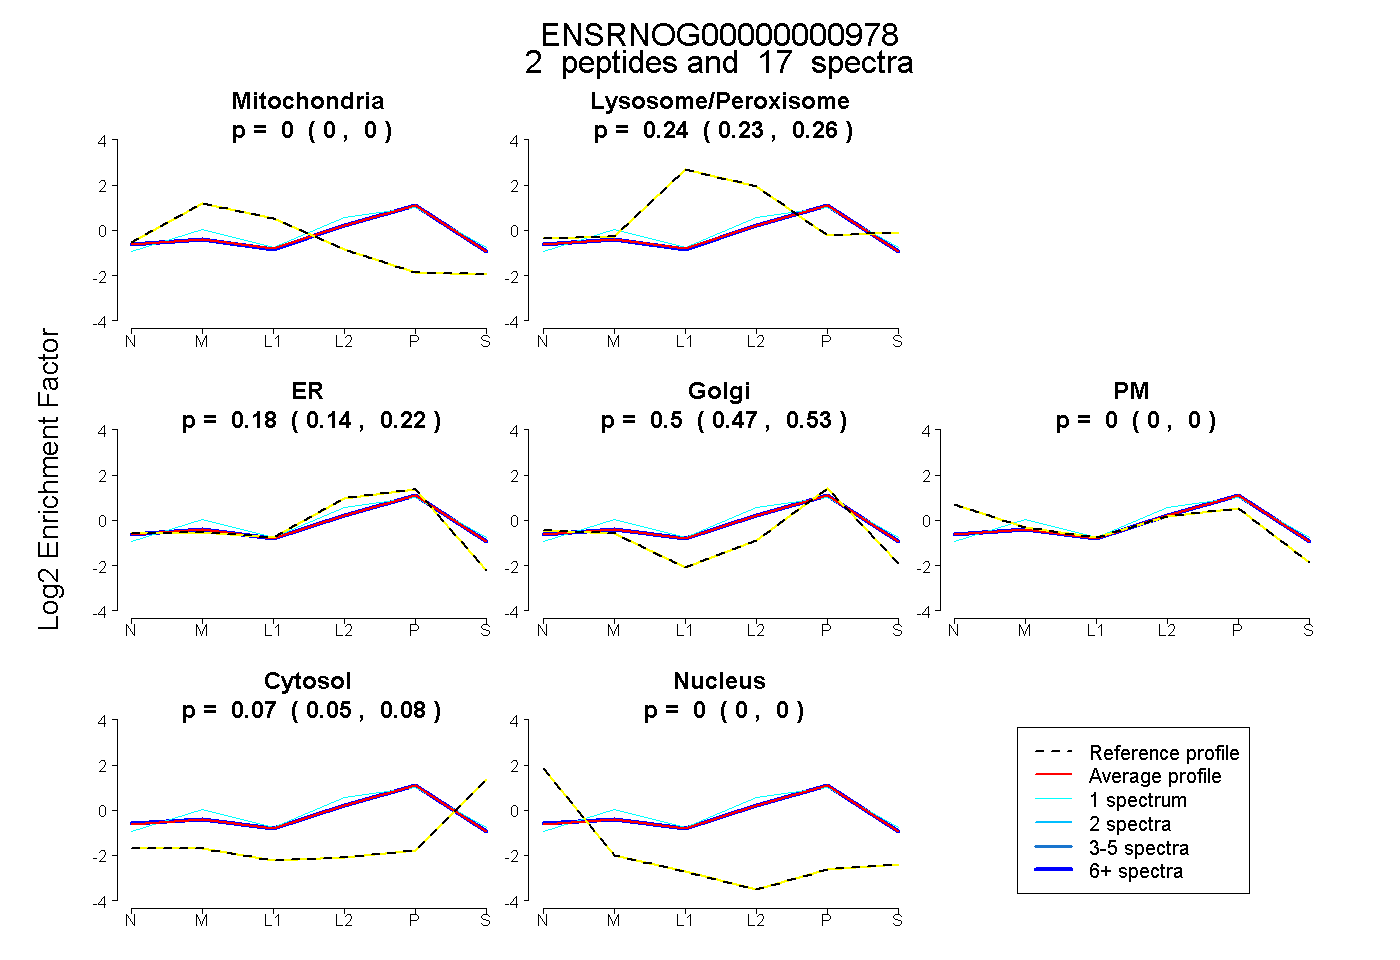 |
0.000
0.000 | 0.000 |
|
0.244
0.227 | 0.259 |
|
0.184
0.145 | 0.217 |
0.504
0.470 | 0.533 |
0.000
0.000 | 0.000 |
0.068
0.054 | 0.079 |
0.000
0.000 | 0.000 |
|
| 16 spectra, DSIAFFQK |
0.000 |
|
0.246 |
|
0.170 |
0.520 |
0.000 |
0.064 |
0.000 |
|
| 1 spectrum, FDMECYK |
0.000 |
|
0.216 |
|
0.416 |
0.250 |
0.000 |
0.117 |
0.000 |
|
| | | Plot |
|
Lyso |
|
|
|
|
|
|
|
Other |
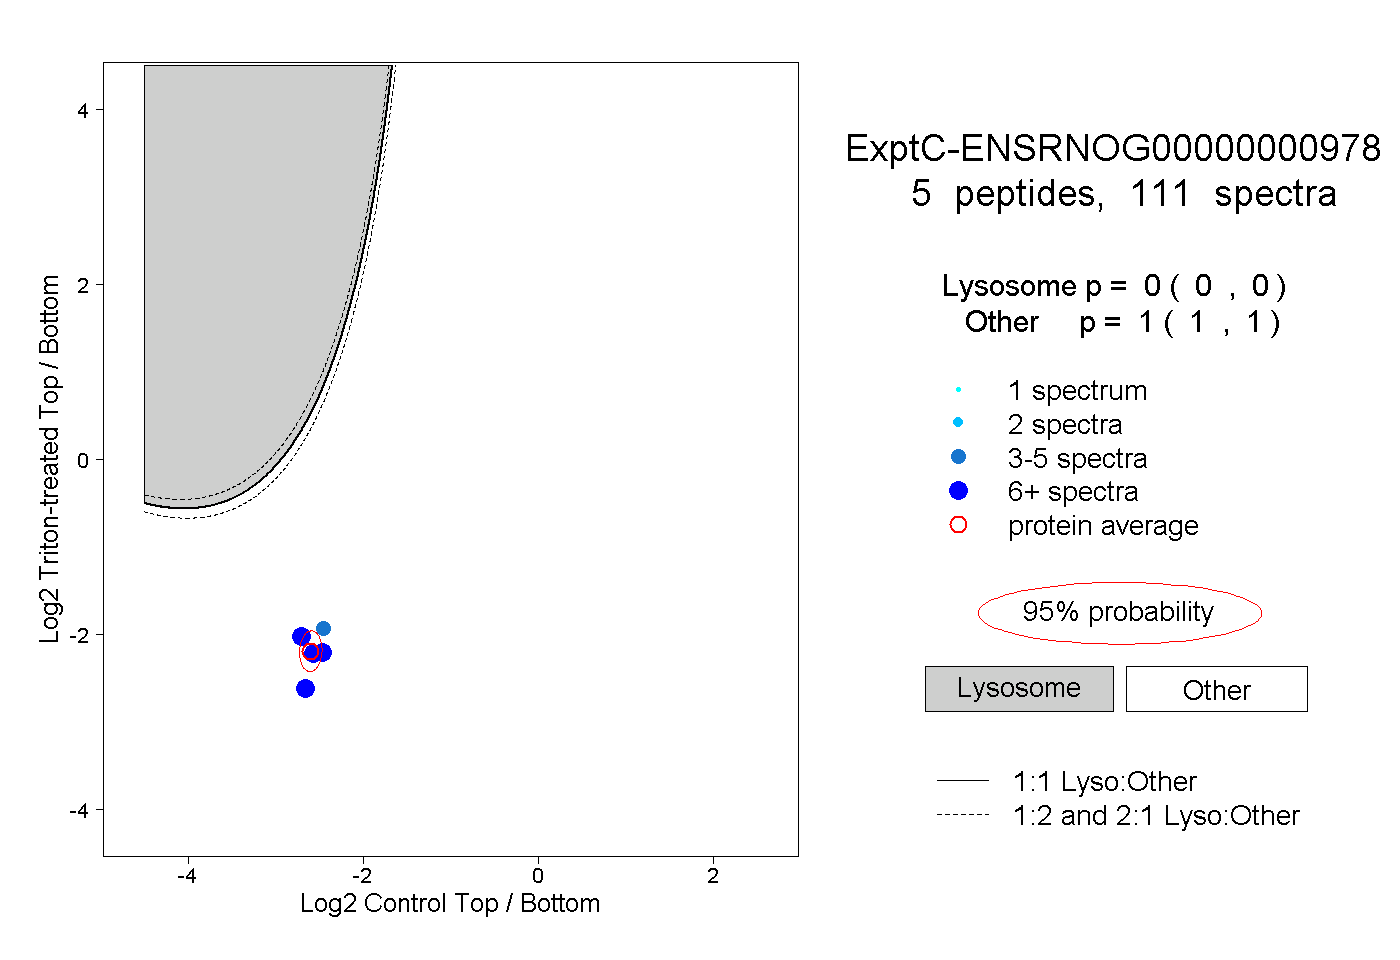
| Expt C |
5
peptides |
111
spectra |
 |
|
0.000
0.000 | 0.000 |
|
|
|
|
|
|
|
1.000
1.000 | 1.000 |
| | | Plot |
|
Lyso |
|
|
|
|
|
|
|
Other |
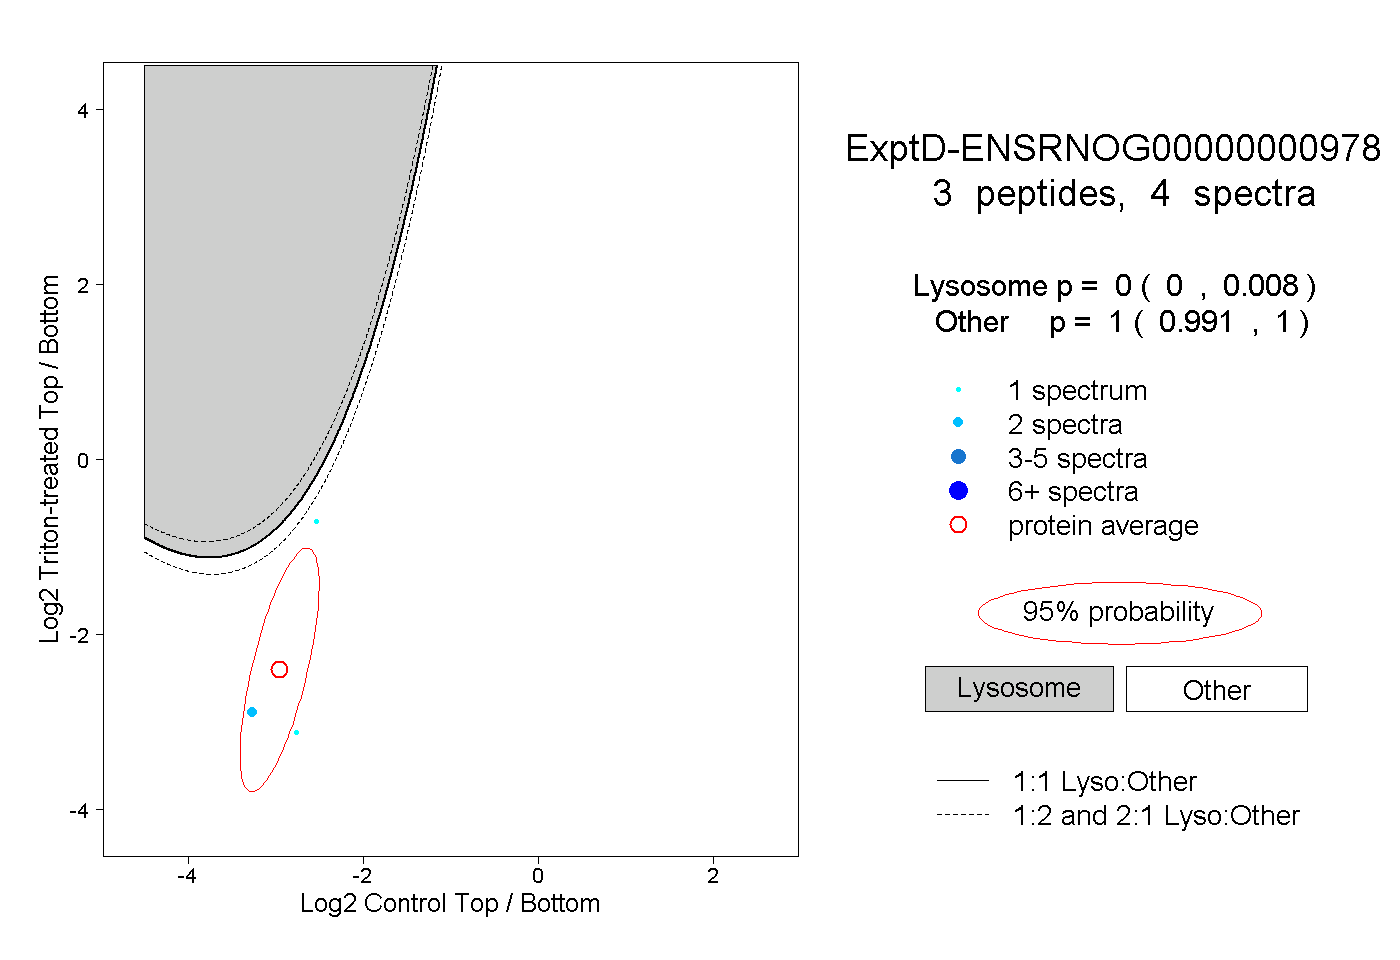
| Expt D |
3
peptides |
4
spectra |
 |
|
0.000
0.000 | 0.008 |
|
|
|
|
|
|
|
1.000
0.991 | 1.000 |