 7
7peptides
spectra

0.000 | 0.000
0.870 | 0.967
0.000 | 0.000
0.000 | 0.023
0.000 | 0.087
0.000 | 0.081
0.000 | 0.050
0.000 | 0.000
7peptides
spectra
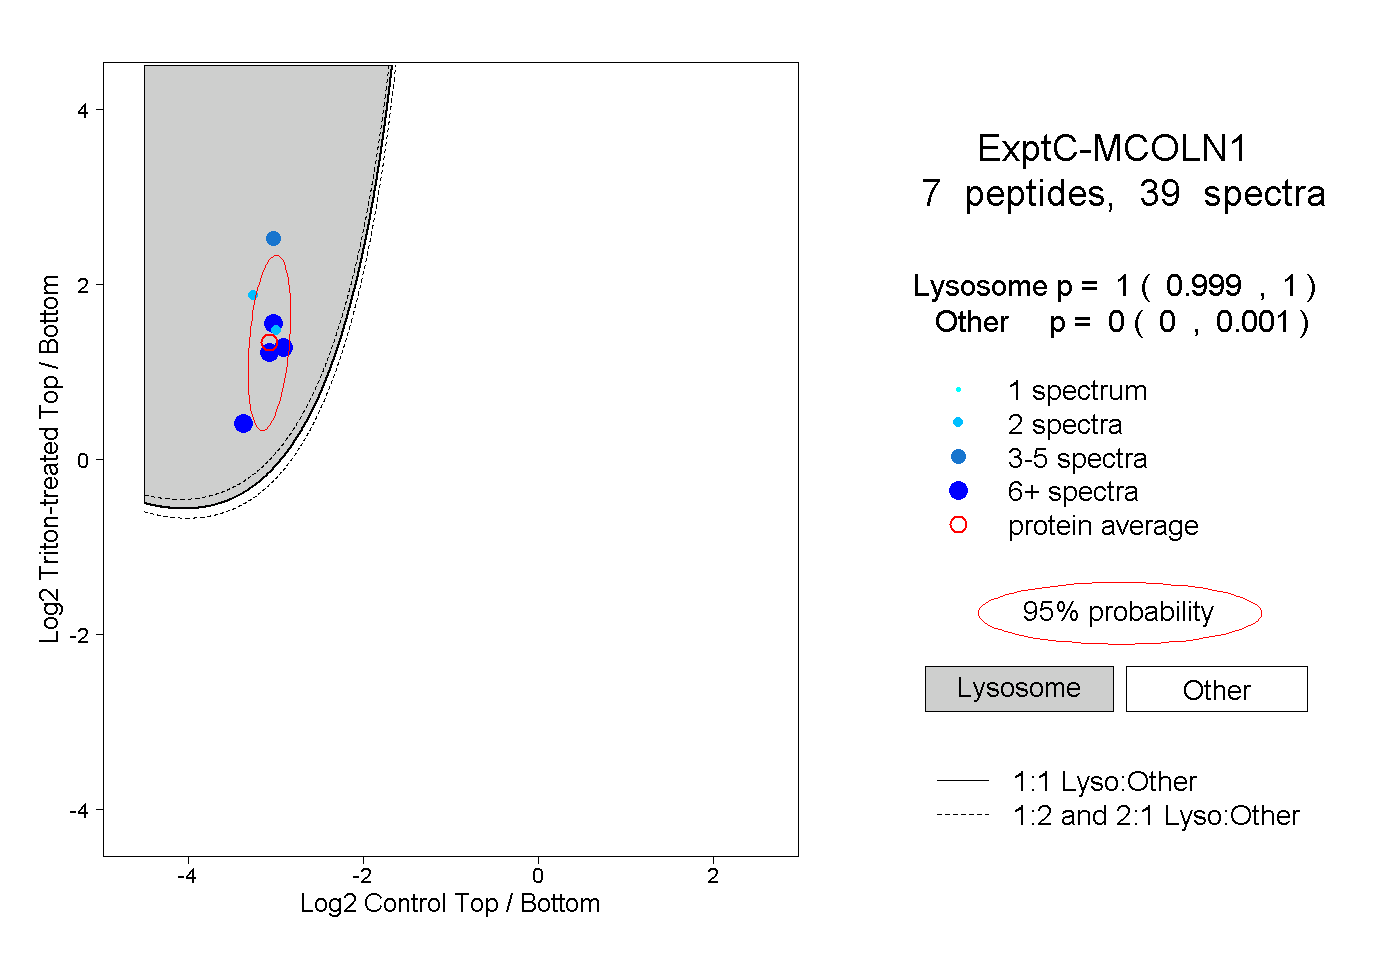
0.999 | 1.000
0.000 | 0.001
1peptide
spectrum
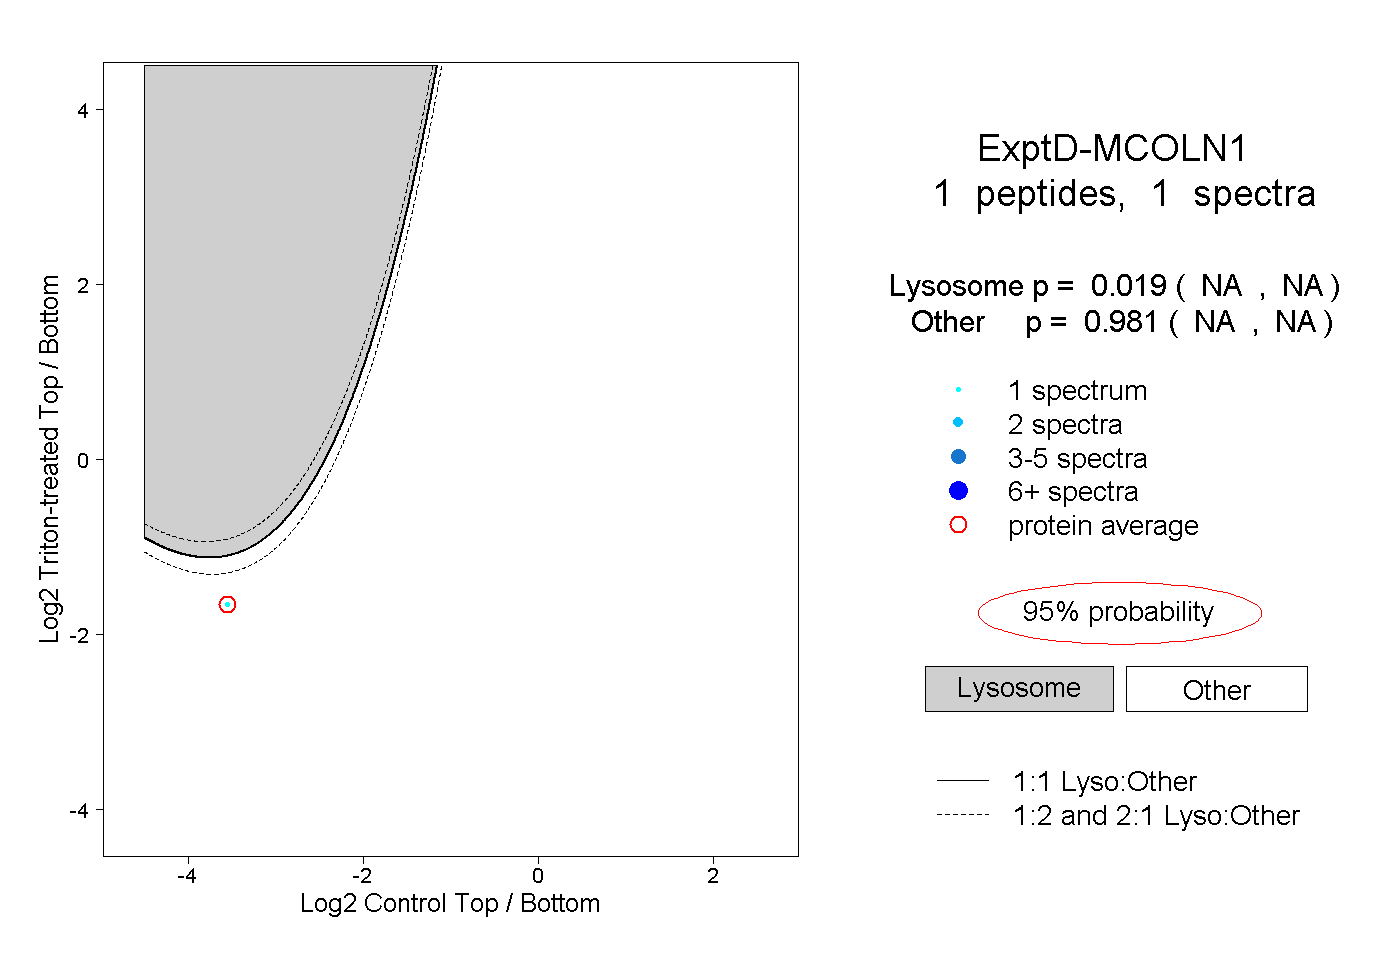
NA | NA
NA | NA