 7
7peptides
spectra

0.000 | 0.000
0.870 | 0.967
0.000 | 0.000
0.000 | 0.023
0.000 | 0.087
0.000 | 0.081
0.000 | 0.050
0.000 | 0.000
| Plot | Mito | Lyso | Perox | ER | Golgi | PM | Cytosol | Nucleus | |||||
| Expt A |
7 peptides |
11 spectra |
|
0.000 0.000 | 0.000 |
0.931 0.870 | 0.967 |
0.000 0.000 | 0.000 |
0.000 0.000 | 0.023 |
0.051 0.000 | 0.087 |
0.000 0.000 | 0.081 |
0.019 0.000 | 0.050 |
0.000 0.000 | 0.000 |
| 1 spectrum, VALPSVMR | 0.000 | 0.932 | 0.000 | 0.000 | 0.057 | 0.000 | 0.012 | 0.000 | ||
| 2 spectra, HGDNSFR | 0.000 | 0.730 | 0.000 | 0.000 | 0.000 | 0.202 | 0.069 | 0.000 | ||
| 3 spectra, EISLWER | 0.000 | 0.972 | 0.000 | 0.000 | 0.000 | 0.028 | 0.000 | 0.000 | ||
| 1 spectrum, LETQTHIQECK | 0.000 | 1.000 | 0.000 | 0.000 | 0.000 | 0.000 | 0.000 | 0.000 | ||
| 2 spectra, YLTFFHK | 0.298 | 0.361 | 0.000 | 0.000 | 0.000 | 0.000 | 0.341 | 0.000 | ||
| 1 spectrum, YNILIATLR | 0.000 | 1.000 | 0.000 | 0.000 | 0.000 | 0.000 | 0.000 | 0.000 | ||
| 1 spectrum, EENTIAFR | 0.000 | 1.000 | 0.000 | 0.000 | 0.000 | 0.000 | 0.000 | 0.000 |
| Plot | Lyso | Other | |||||||||||
| Expt C |
7 peptides |
39 spectra |
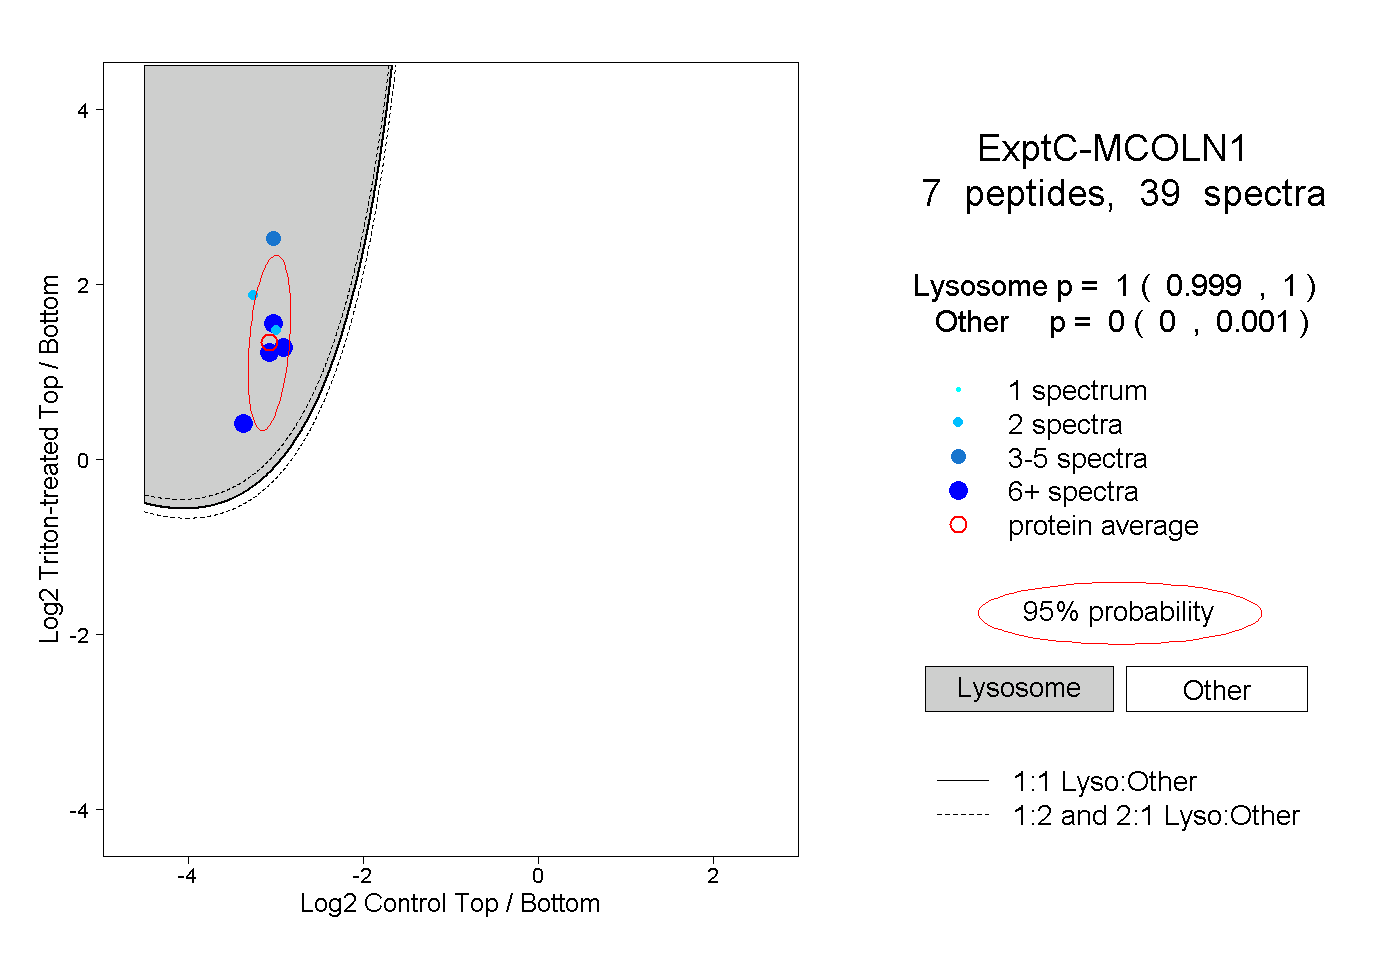 |
1.000 0.999 | 1.000 |
0.000 0.000 | 0.001 |
||||||||
| Plot | Lyso | Other | |||||||||||
| Expt D |
1 peptide |
1 spectrum |
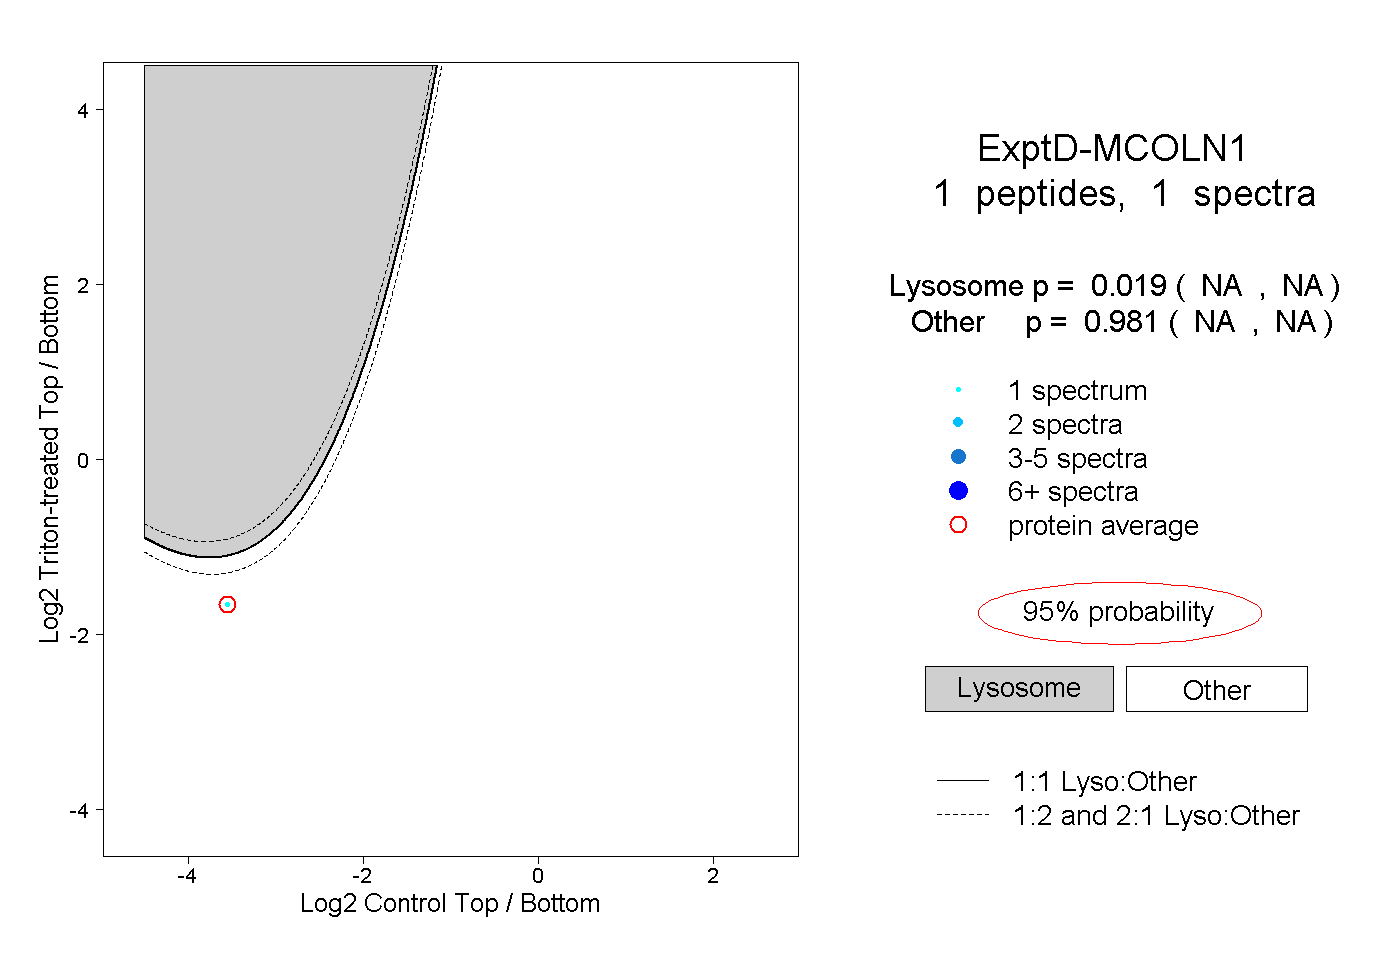 |
0.019 NA | NA |
0.981 NA | NA |