 7
7peptides
spectra
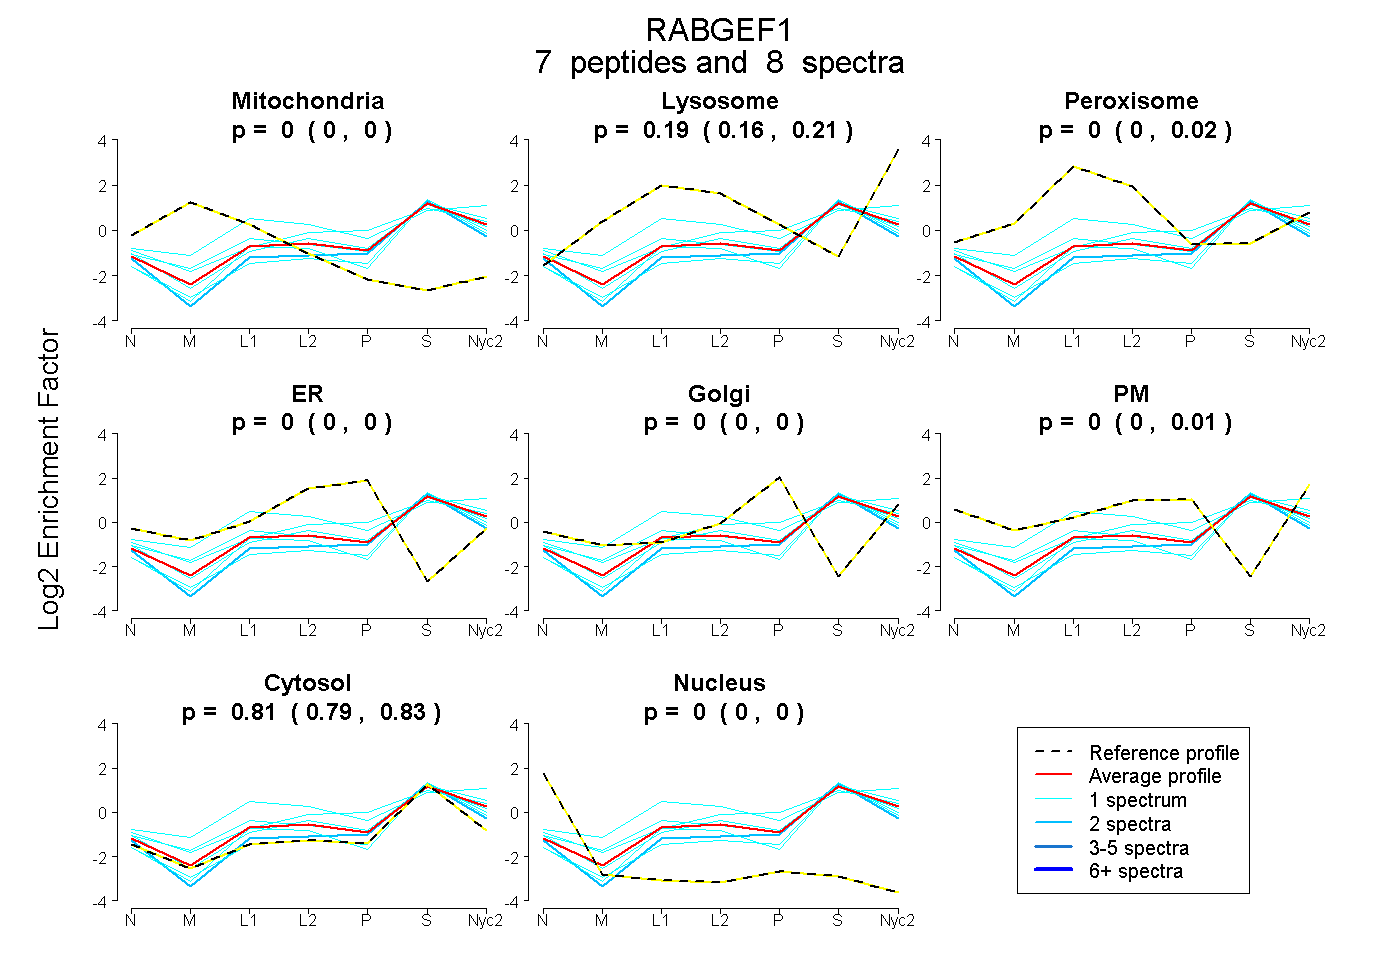
0.000 | 0.000
0.161 | 0.207
0.000 | 0.017
0.000 | 0.000
0.000 | 0.000
0.000 | 0.007
0.787 | 0.827
0.000 | 0.000
1peptide
spectrum
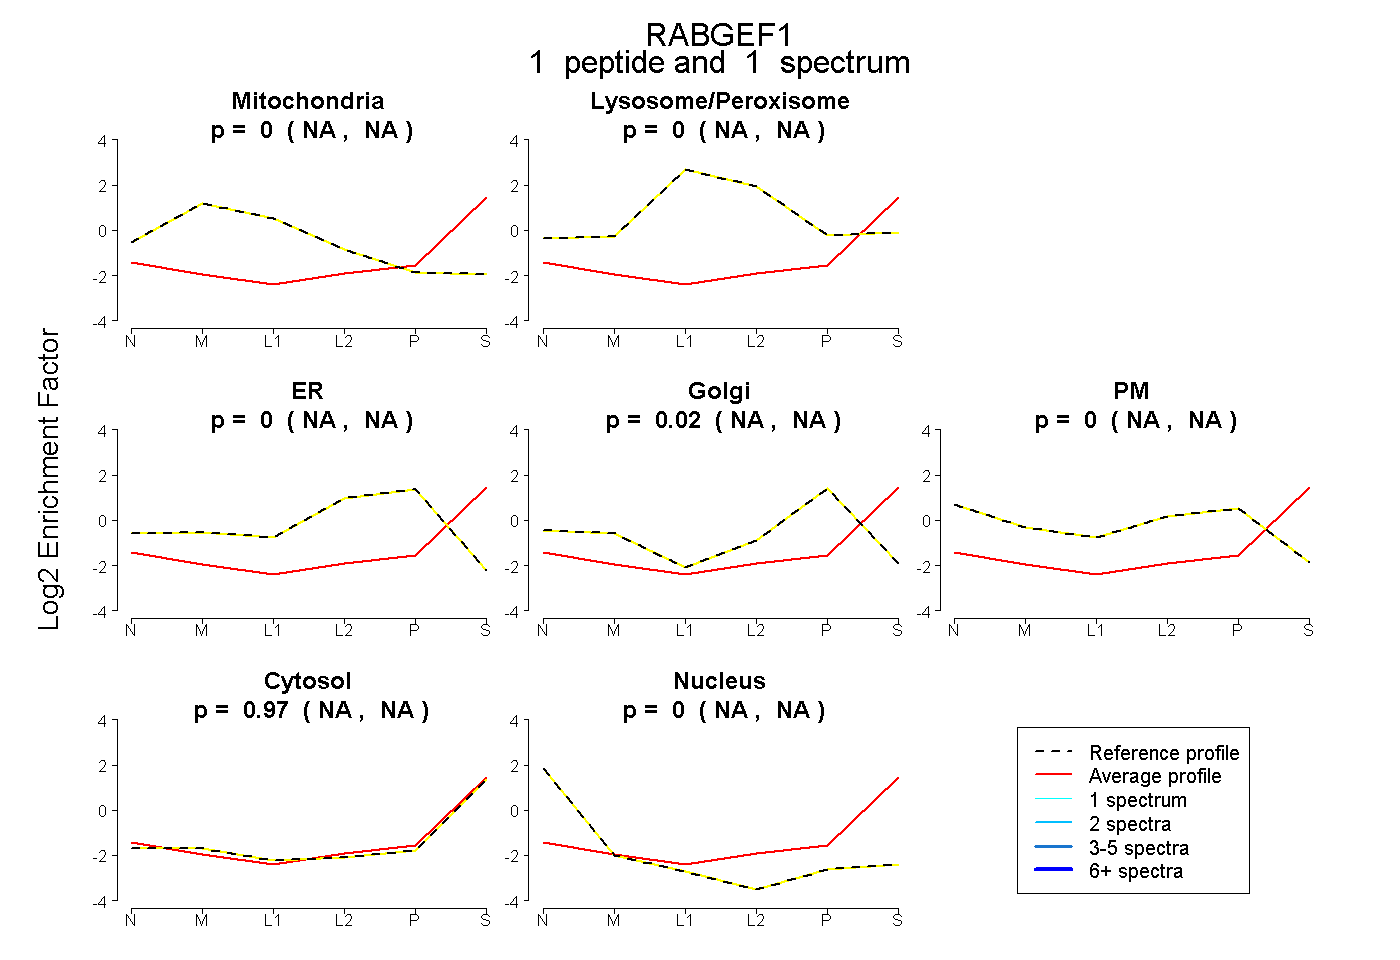
NA | NA
NA | NA
NA | NA
NA | NA
NA | NA
NA | NA
NA | NA
3peptides
spectra
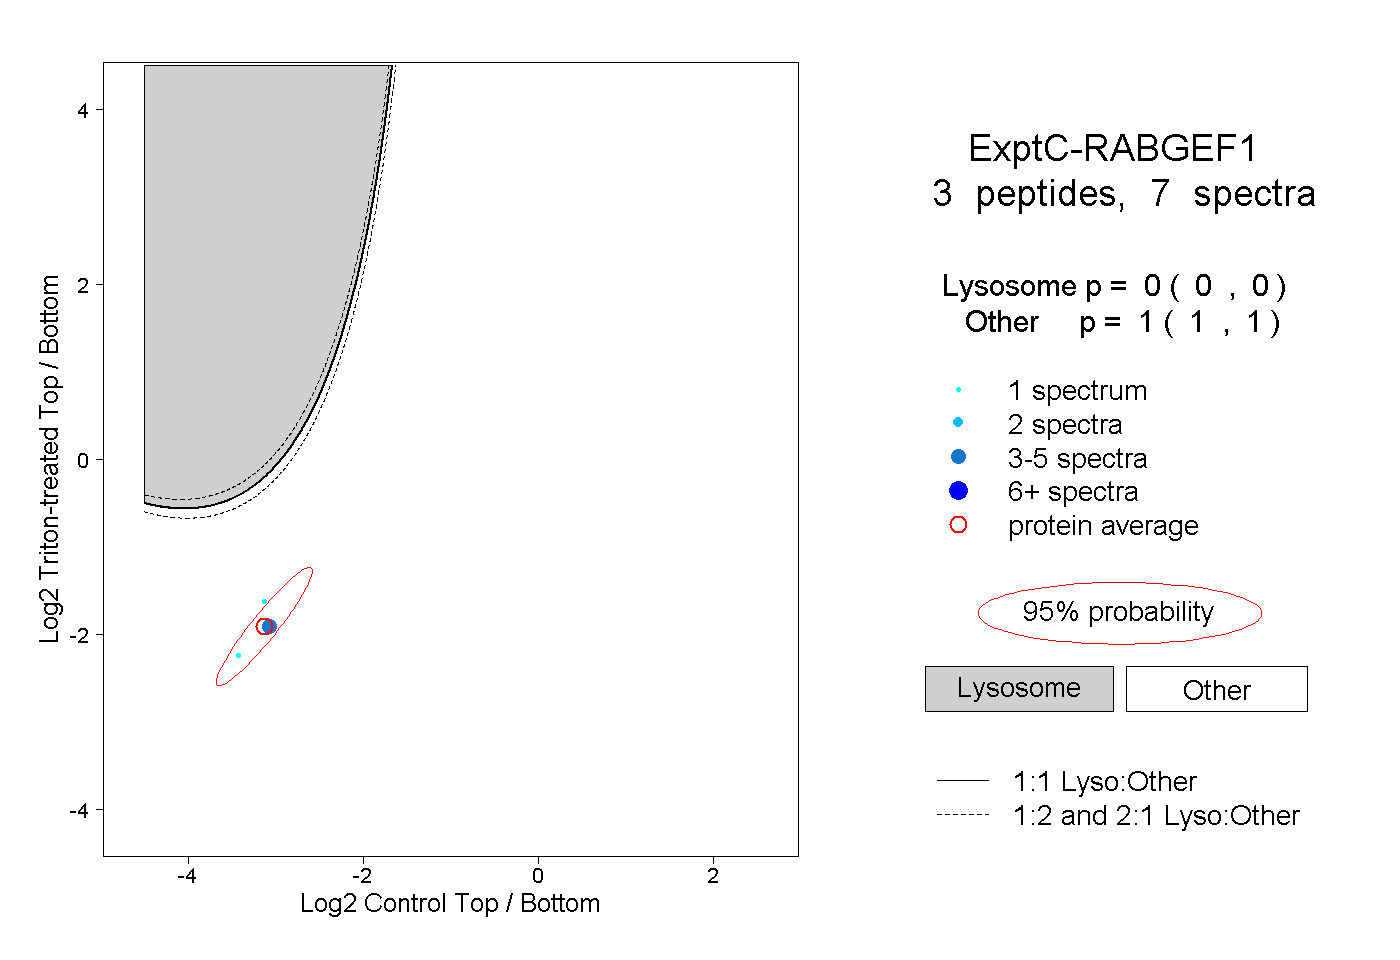
0.000 | 0.000
1.000 | 1.000