 7
7peptides
spectra
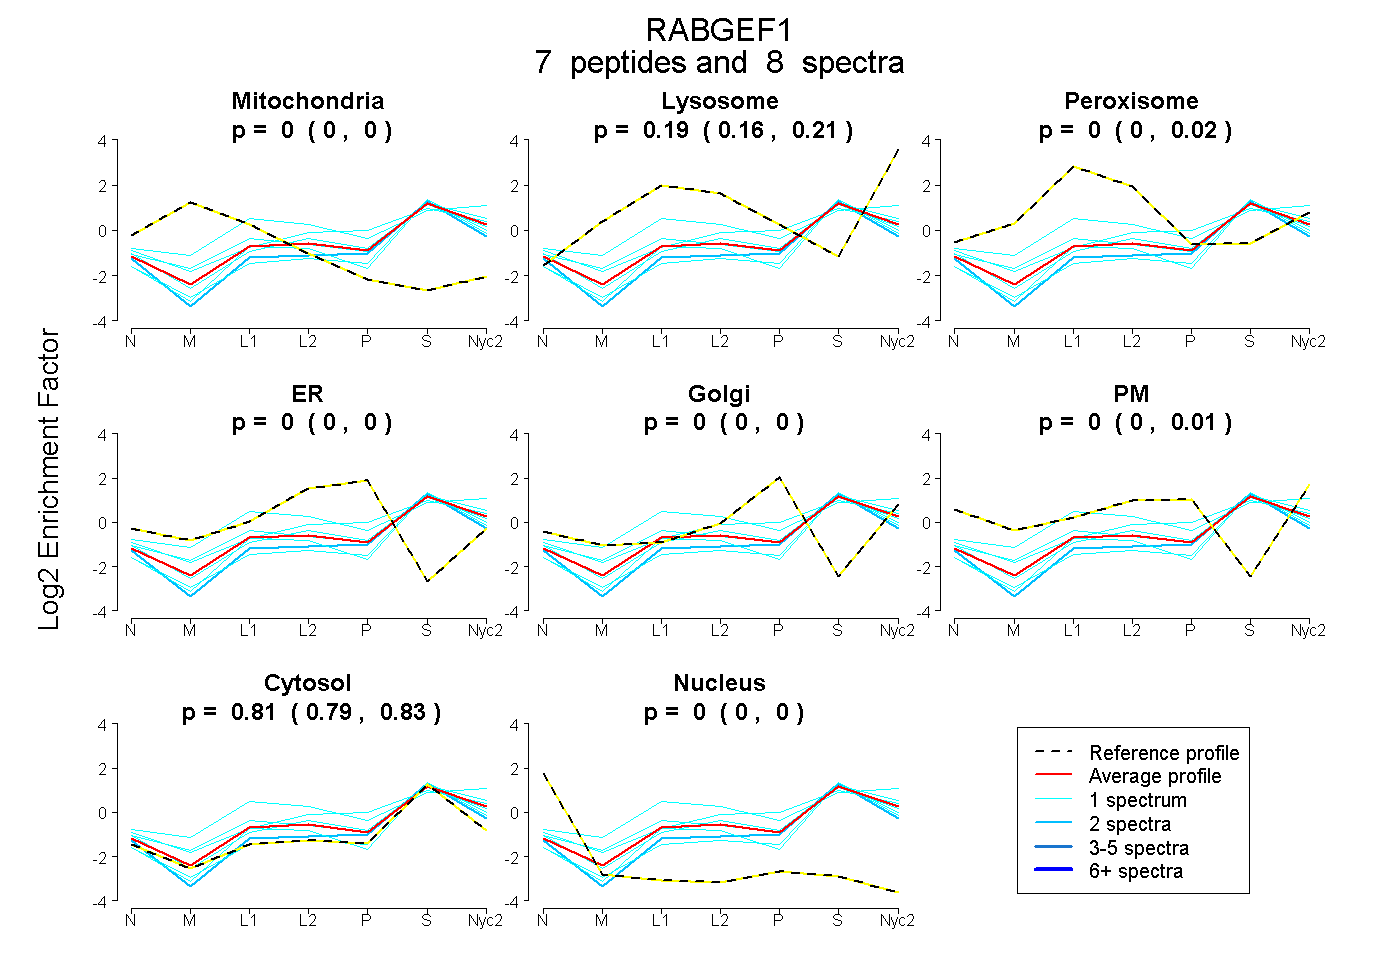
0.000 | 0.000
0.161 | 0.207
0.000 | 0.017
0.000 | 0.000
0.000 | 0.000
0.000 | 0.007
0.787 | 0.827
0.000 | 0.000
| Plot | Mito | Lyso | Perox | ER | Golgi | PM | Cytosol | Nucleus | |||||
| Expt A |
7 peptides |
8 spectra |
|
0.000 0.000 | 0.000 |
0.191 0.161 | 0.207 |
0.000 0.000 | 0.017 |
0.000 0.000 | 0.000 |
0.000 0.000 | 0.000 |
0.000 0.000 | 0.007 |
0.809 0.787 | 0.827 |
0.000 0.000 | 0.000 |
| 1 spectrum, LACITR | 0.000 | 0.311 | 0.194 | 0.000 | 0.000 | 0.000 | 0.495 | 0.000 | ||
| 1 spectrum, DLIDWTDGIAK | 0.000 | 0.089 | 0.000 | 0.000 | 0.000 | 0.000 | 0.911 | 0.000 | ||
| 1 spectrum, LDAQSLNLSQEDFDR | 0.000 | 0.024 | 0.000 | 0.000 | 0.000 | 0.000 | 0.976 | 0.000 | ||
| 2 spectra, APSPSINR | 0.000 | 0.026 | 0.000 | 0.000 | 0.018 | 0.000 | 0.956 | 0.000 | ||
| 1 spectrum, HIFNAIK | 0.000 | 0.189 | 0.000 | 0.043 | 0.062 | 0.050 | 0.657 | 0.000 | ||
| 1 spectrum, NEPASADDFLPTLIYIVLK | 0.000 | 0.145 | 0.116 | 0.000 | 0.000 | 0.000 | 0.739 | 0.000 | ||
| 1 spectrum, EFIDFLK | 0.000 | 0.192 | 0.000 | 0.000 | 0.000 | 0.015 | 0.794 | 0.000 |
| Plot | Mito | Lyso or Perox | ER | Golgi | PM | Cytosol | Nucleus | ||||||
| Expt B |
1 peptide |
1 spectrum |
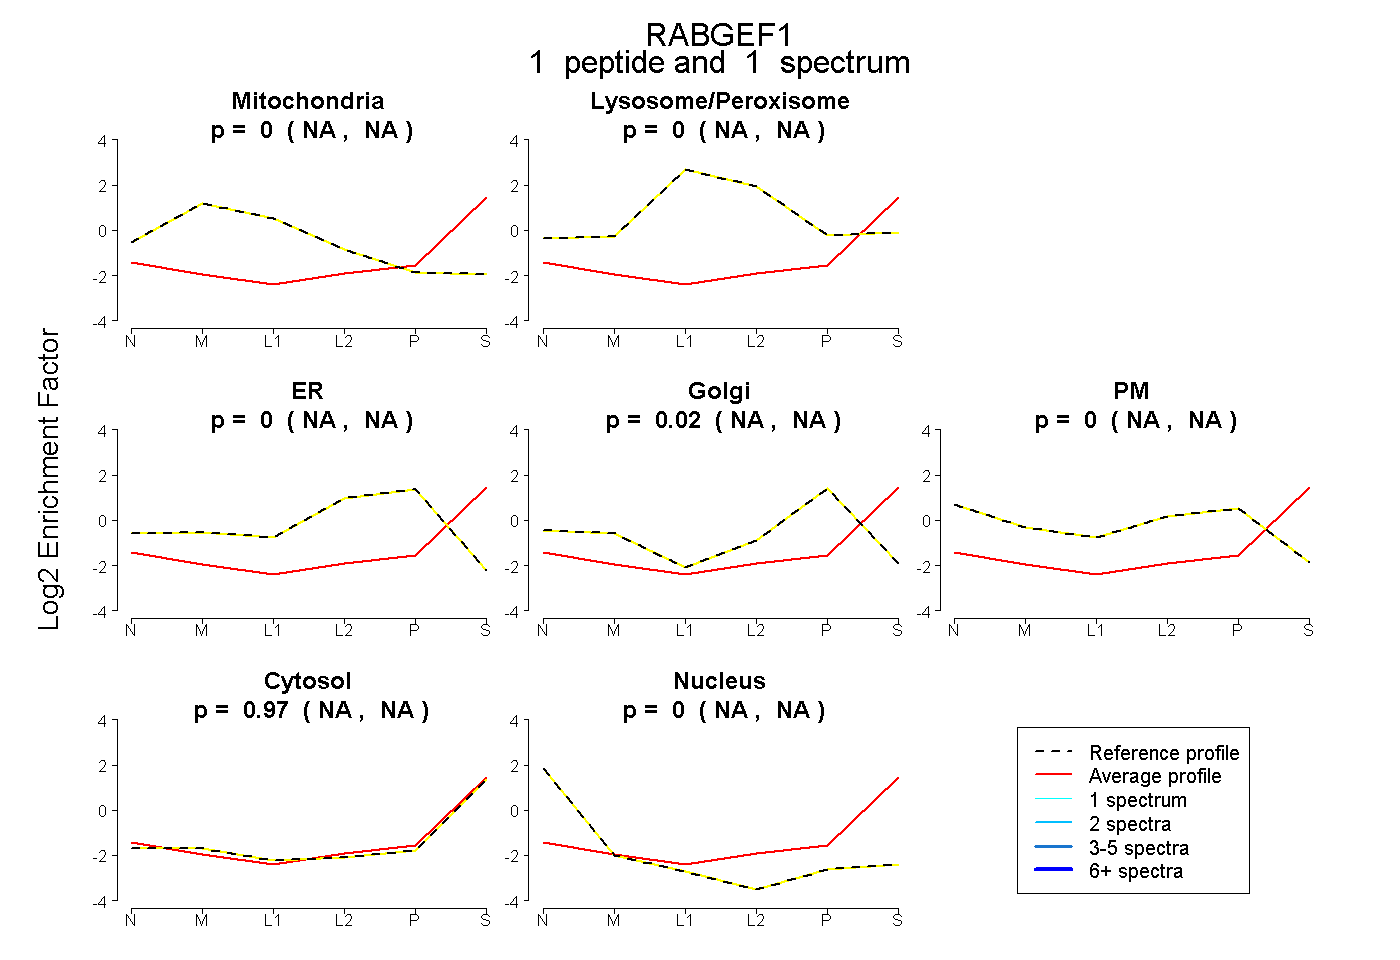 |
0.000 NA | NA |
0.000 NA | NA |
0.000 NA | NA |
0.023 NA | NA |
0.000 NA | NA |
0.974 NA | NA |
0.003 NA | NA |
|||
| Plot | Lyso | Other | |||||||||||
| Expt C |
3 peptides |
7 spectra |
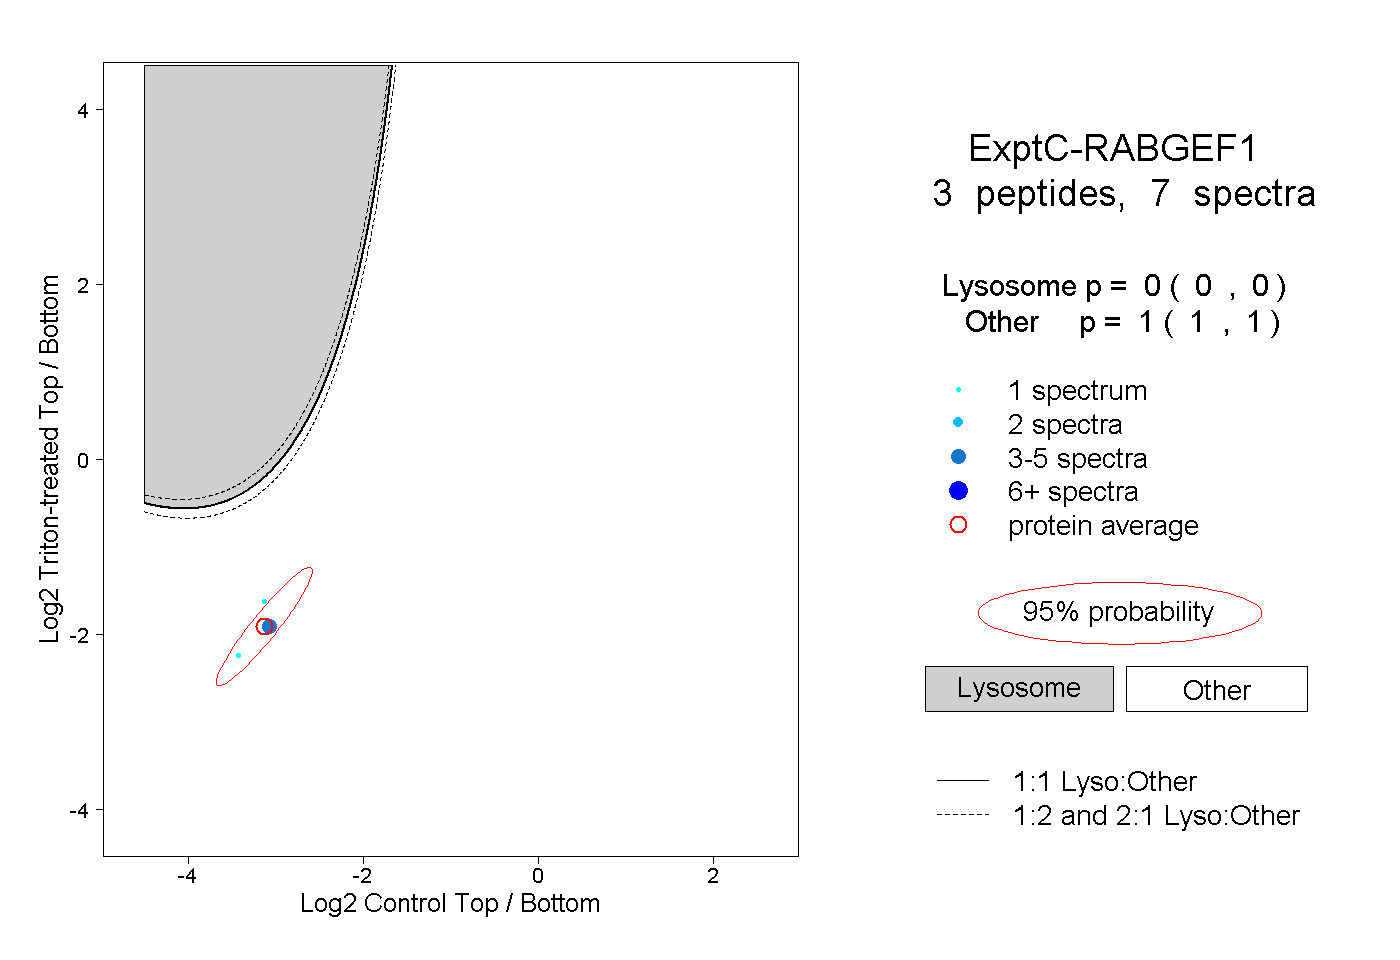 |
0.000 0.000 | 0.000 |
1.000 1.000 | 1.000 |