 5
5peptides
spectra
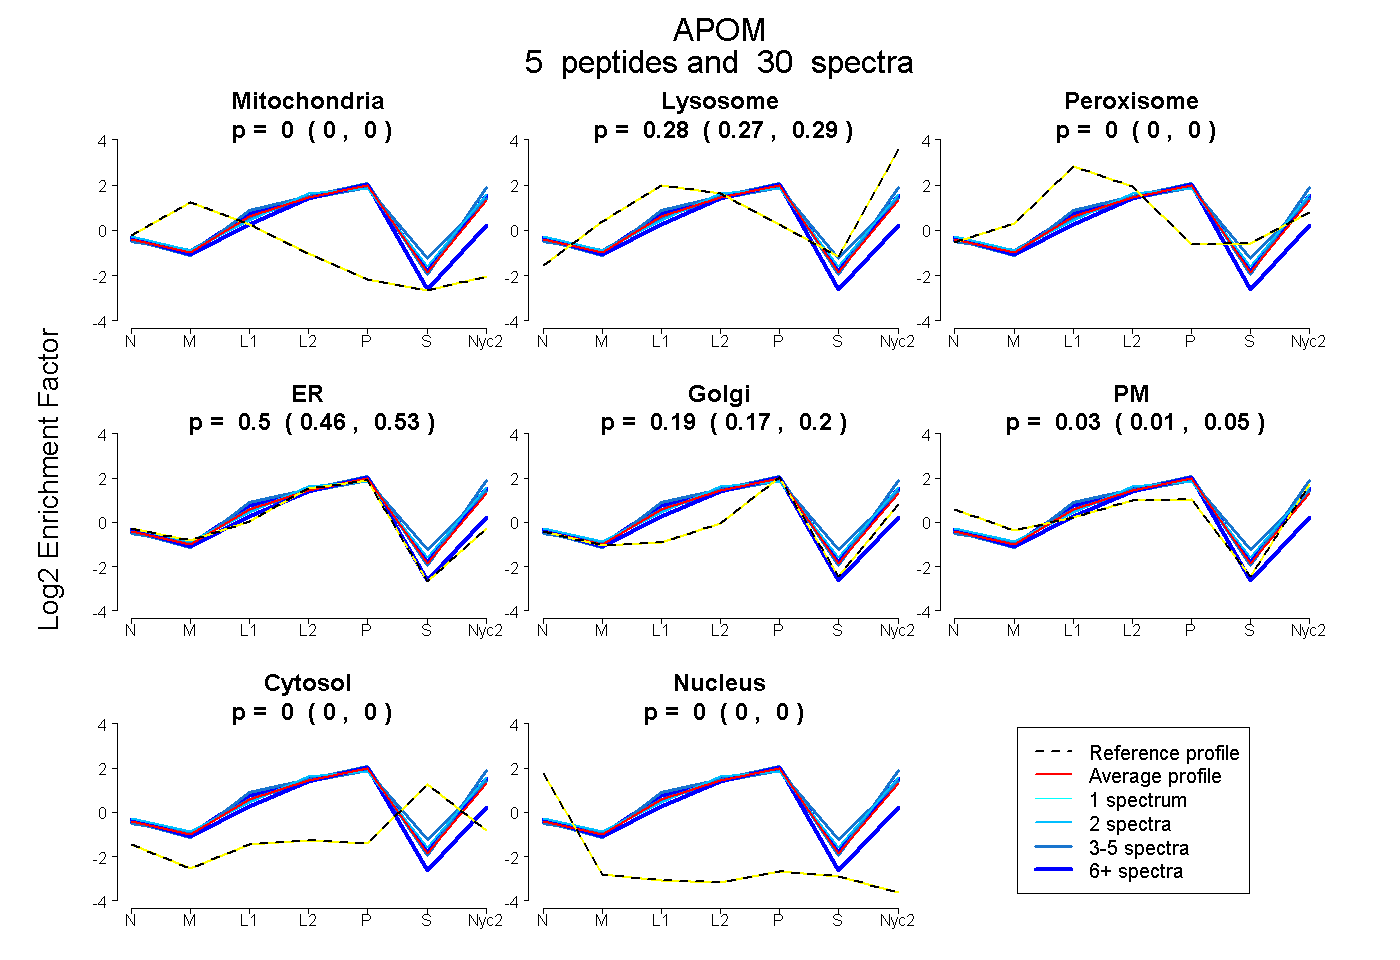
0.000 | 0.000
0.267 | 0.292
0.000 | 0.000
0.461 | 0.528
0.172 | 0.202
0.010 | 0.052
0.000 | 0.000
0.000 | 0.000
2peptides
spectra
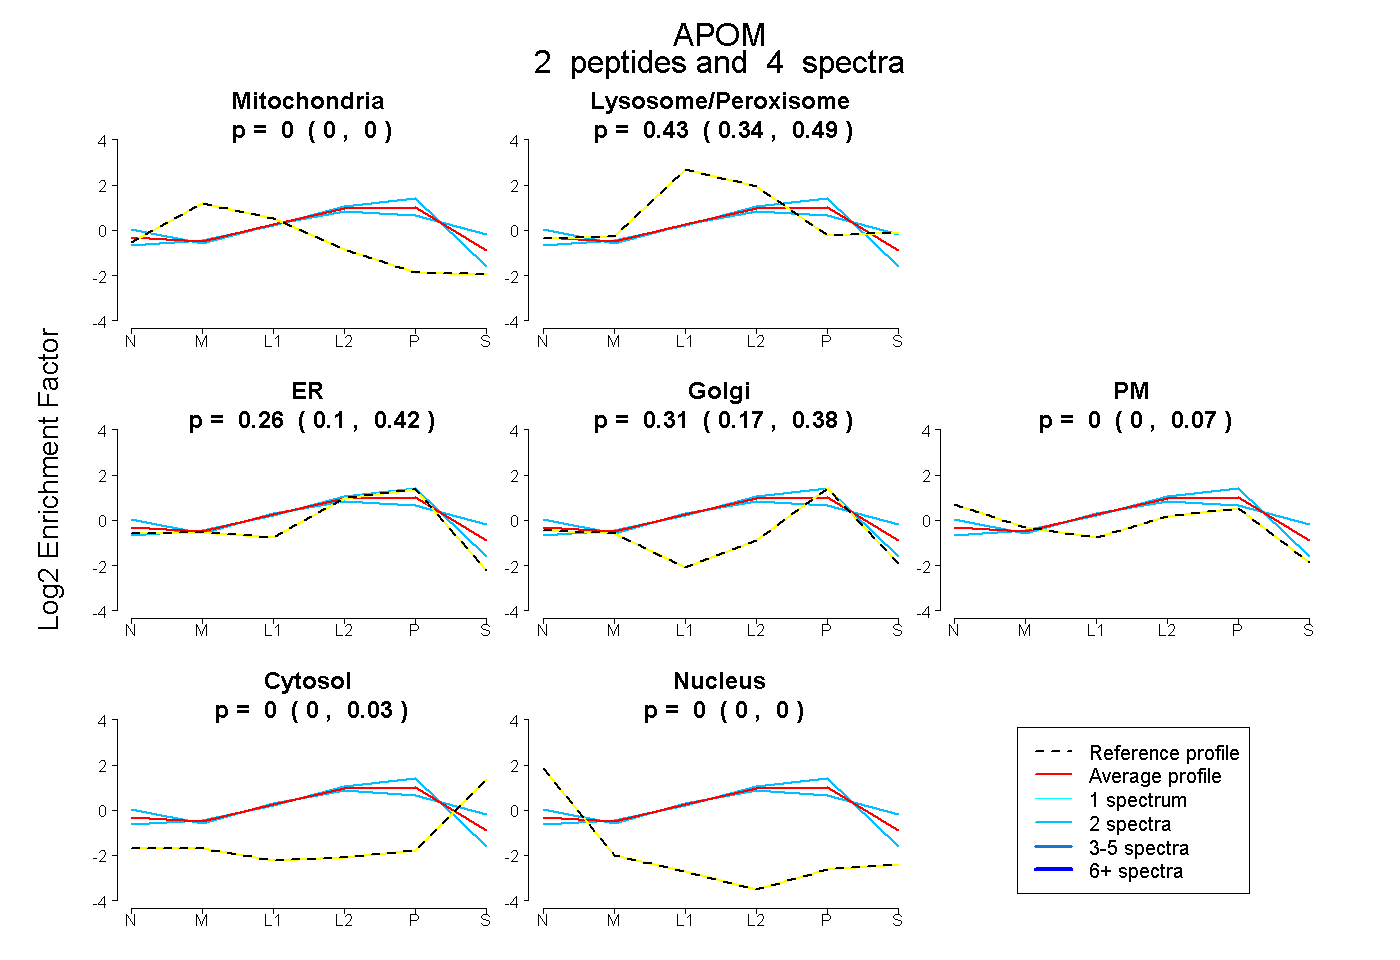
0.000 | 0.000
0.341 | 0.487
0.095 | 0.418
0.171 | 0.384
0.000 | 0.071
0.000 | 0.029
0.000 | 0.000
5peptides
spectra
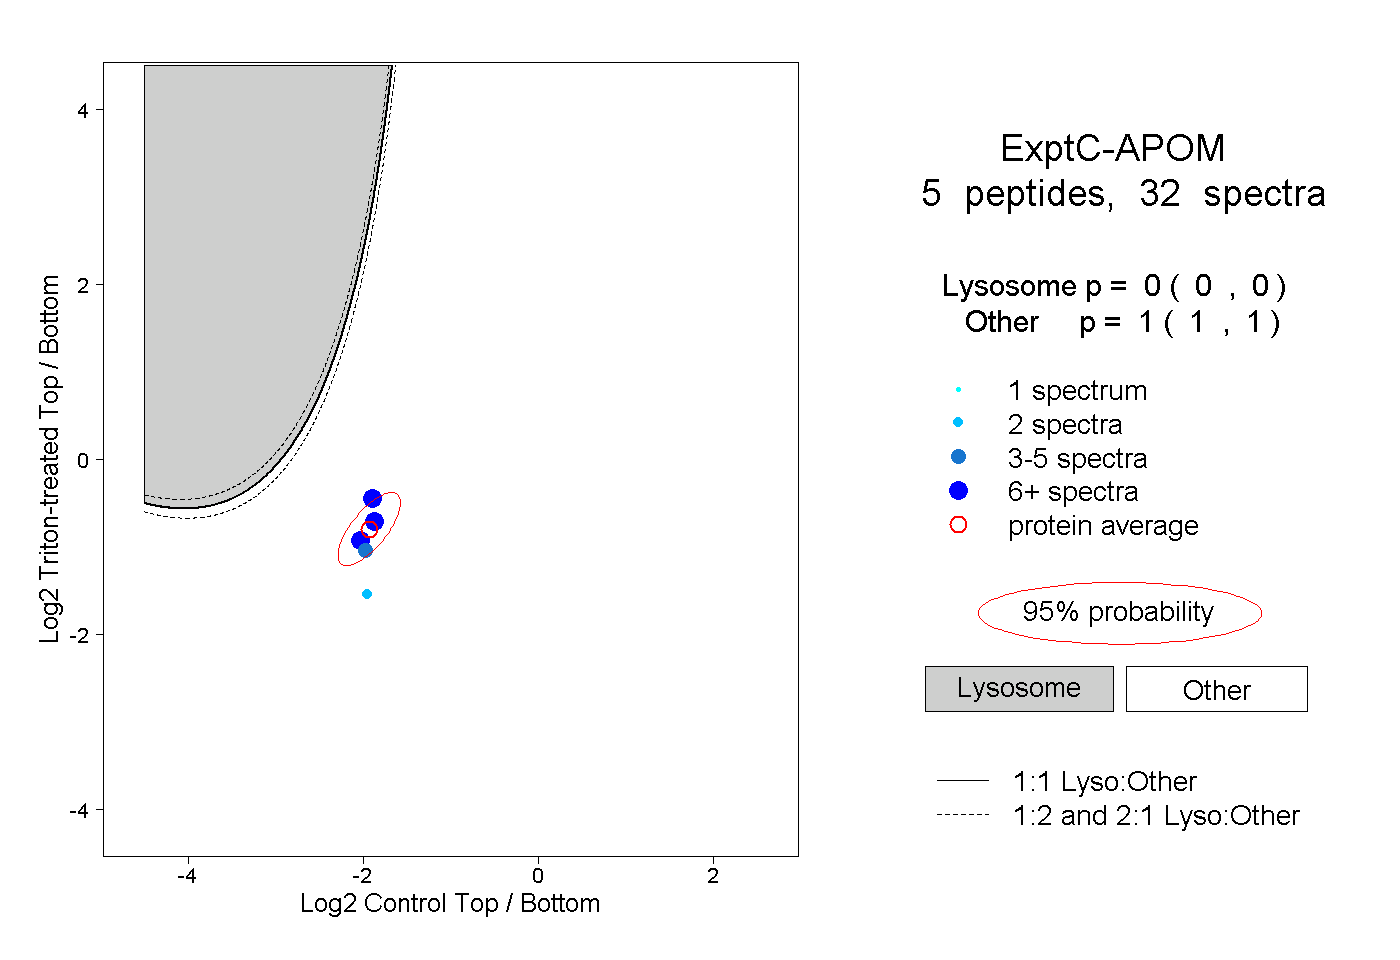
0.000 | 0.000
1.000 | 1.000