 5
5peptides
spectra
0.000 | 0.000
0.267 | 0.292
0.000 | 0.000
0.461 | 0.528
0.172 | 0.202
0.010 | 0.052
0.000 | 0.000
0.000 | 0.000
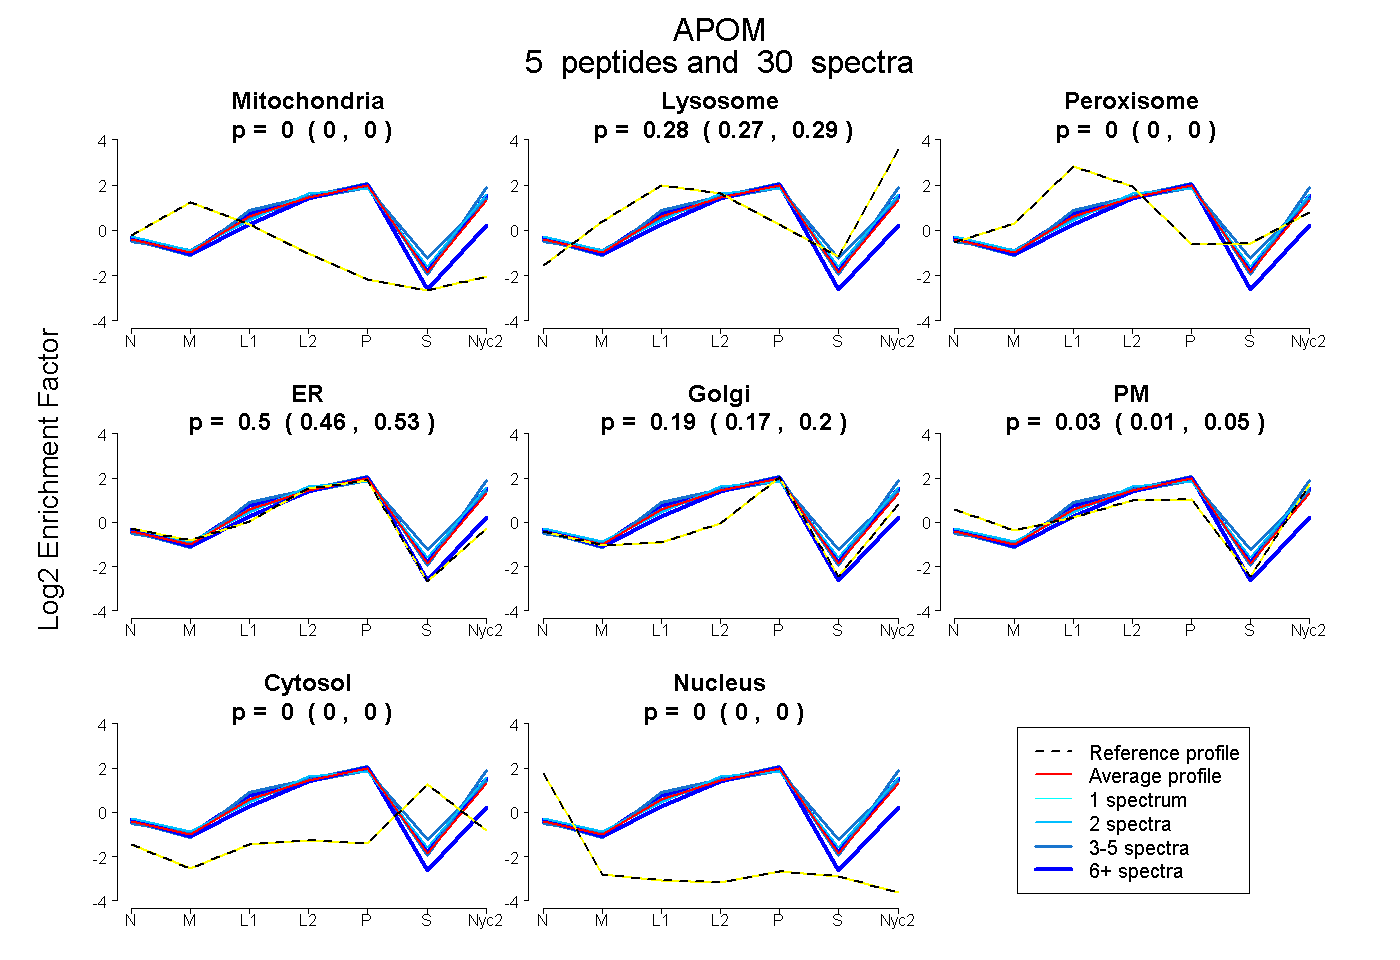
| Plot | Mito | Lyso | Perox | ER | Golgi | PM | Cytosol | Nucleus | |||||
| Expt A |
5 peptides |
30 spectra |
|
0.000 0.000 | 0.000 |
0.281 0.267 | 0.292 |
0.000 0.000 | 0.000 |
0.497 0.461 | 0.528 |
0.188 0.172 | 0.202 |
0.034 0.010 | 0.052 |
0.000 0.000 | 0.000 |
0.000 0.000 | 0.000 |
| 2 spectra, TEGRPDMK | 0.000 | 0.297 | 0.000 | 0.415 | 0.144 | 0.144 | 0.000 | 0.000 | ||
| 6 spectra, NQEACPLSSK | 0.000 | 0.061 | 0.000 | 0.833 | 0.101 | 0.006 | 0.000 | 0.000 | ||
| 4 spectra, ETGQGYQR | 0.000 | 0.344 | 0.000 | 0.370 | 0.183 | 0.103 | 0.000 | 0.000 | ||
| 5 spectra, GNTELR | 0.000 | 0.347 | 0.000 | 0.418 | 0.194 | 0.000 | 0.041 | 0.000 | ||
| 13 spectra, AFLVTPR | 0.000 | 0.325 | 0.000 | 0.449 | 0.176 | 0.050 | 0.000 | 0.000 |
| Plot | Mito | Lyso or Perox | ER | Golgi | PM | Cytosol | Nucleus | ||||||
| Expt B |
2 peptides |
4 spectra |
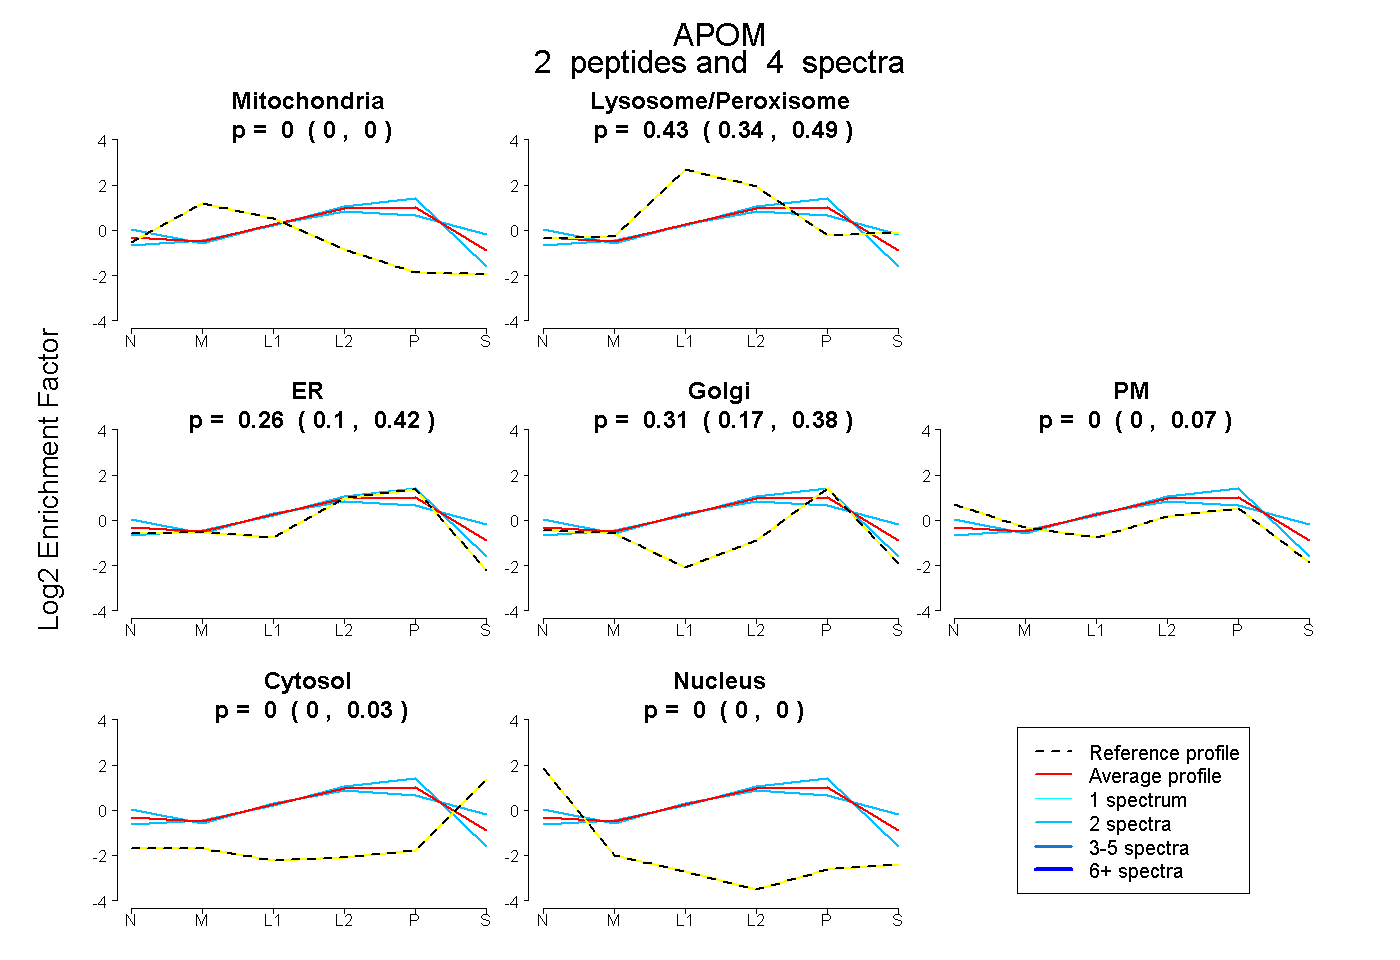 |
0.000 0.000 | 0.000 |
0.432 0.341 | 0.487 |
0.259 0.095 | 0.418 |
0.309 0.171 | 0.384 |
0.000 0.000 | 0.071 |
0.000 0.000 | 0.029 |
0.000 0.000 | 0.000 |
|||
| Plot | Lyso | Other | |||||||||||
| Expt C |
5 peptides |
32 spectra |
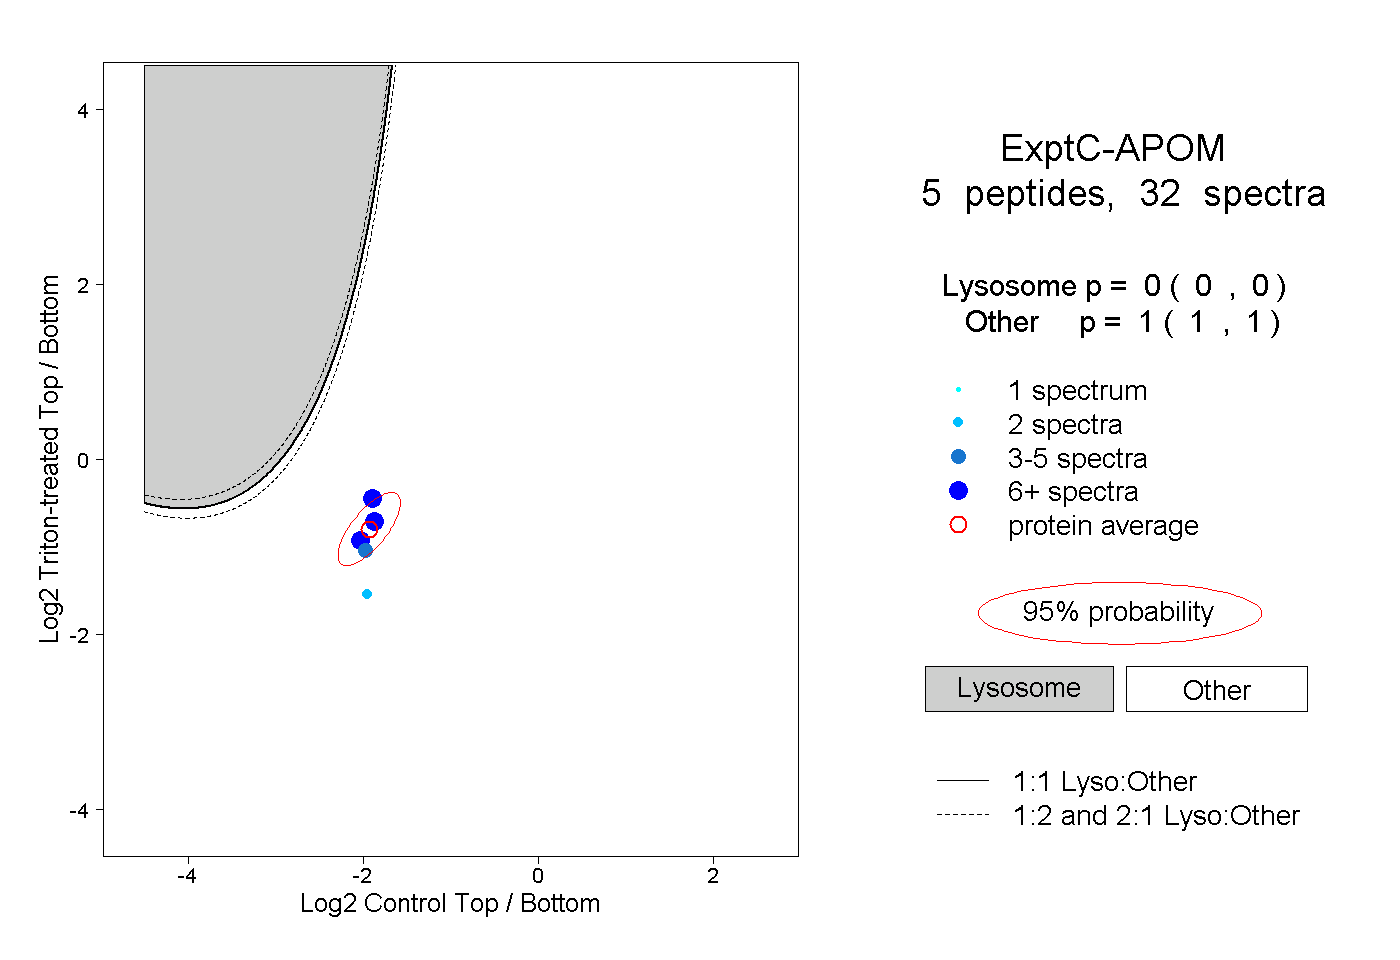 |
0.000 0.000 | 0.000 |
1.000 1.000 | 1.000 |