 13
13peptides
spectra
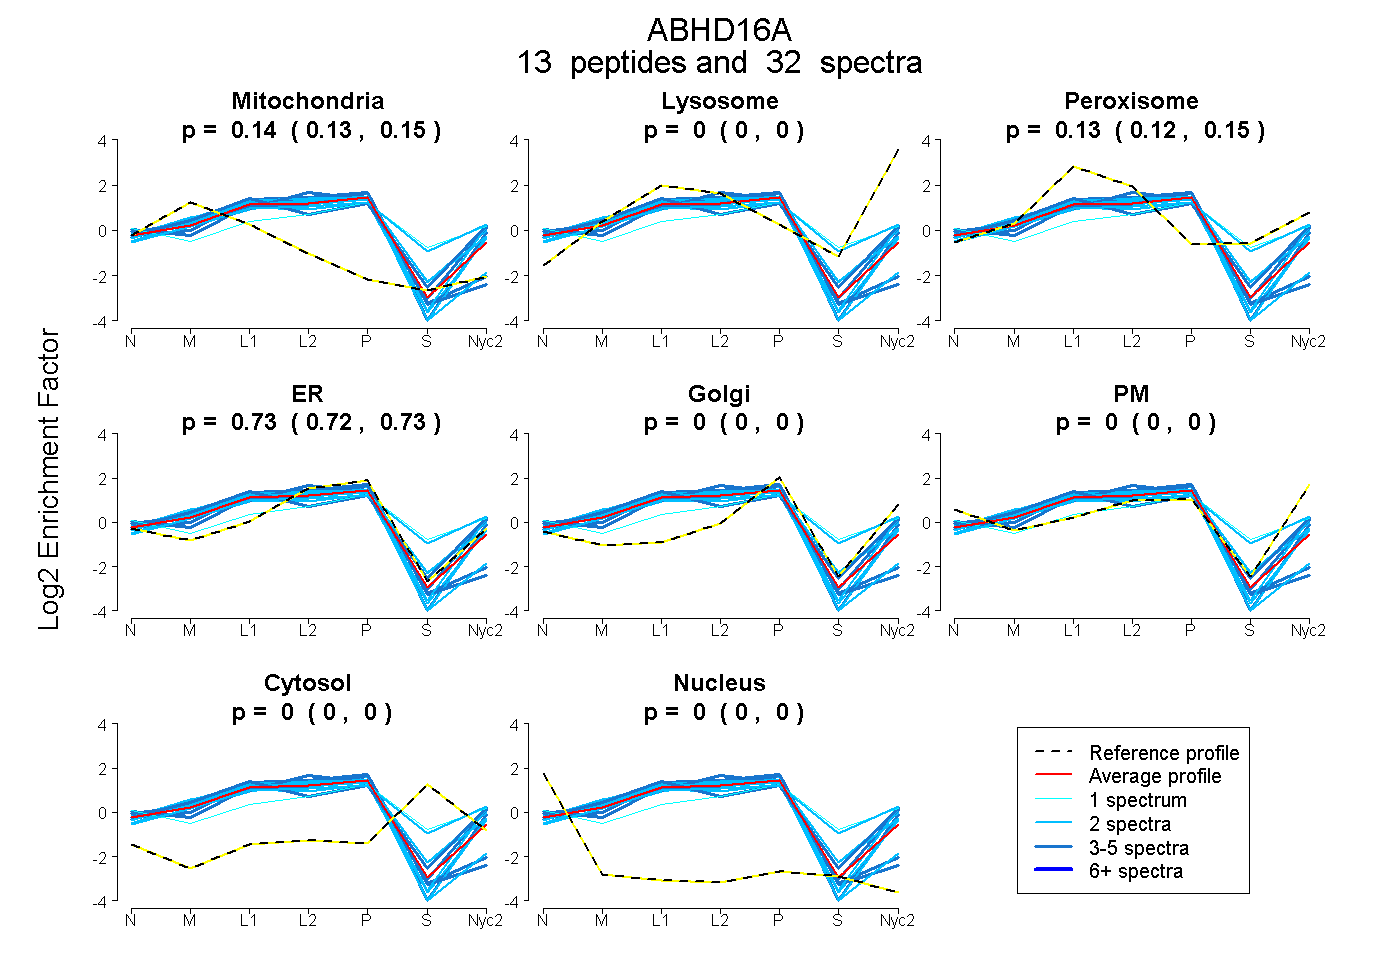
0.128 | 0.149
0.000 | 0.000
0.117 | 0.146
0.719 | 0.734
0.000 | 0.000
0.000 | 0.000
0.000 | 0.000
0.000 | 0.000
8peptides
spectra
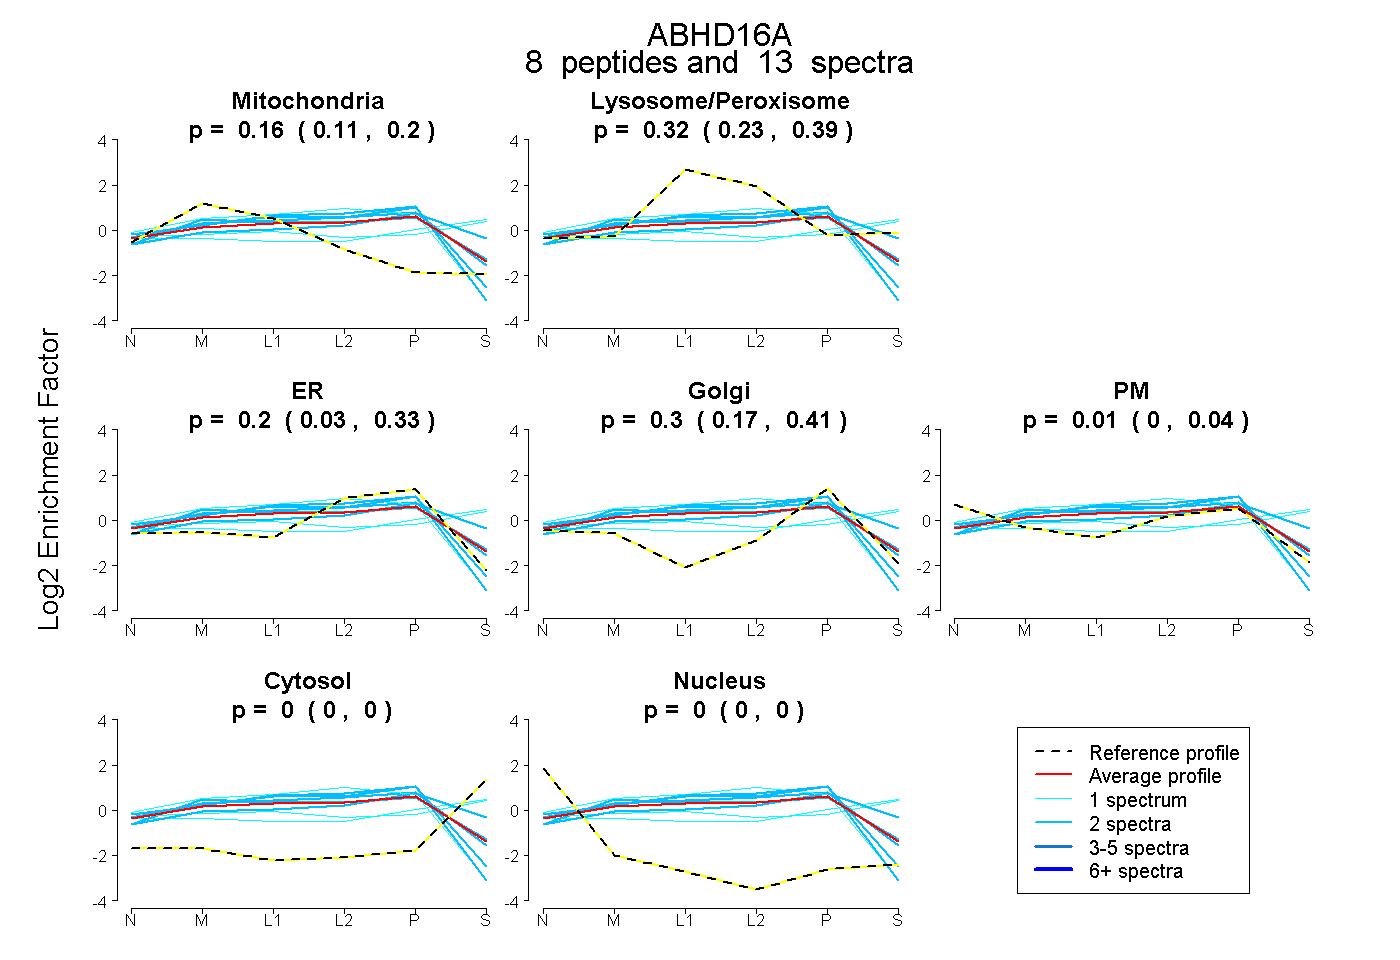
0.110 | 0.198
0.234 | 0.395
0.032 | 0.328
0.166 | 0.414
0.000 | 0.043
0.000 | 0.000
0.000 | 0.000
19peptides
spectra
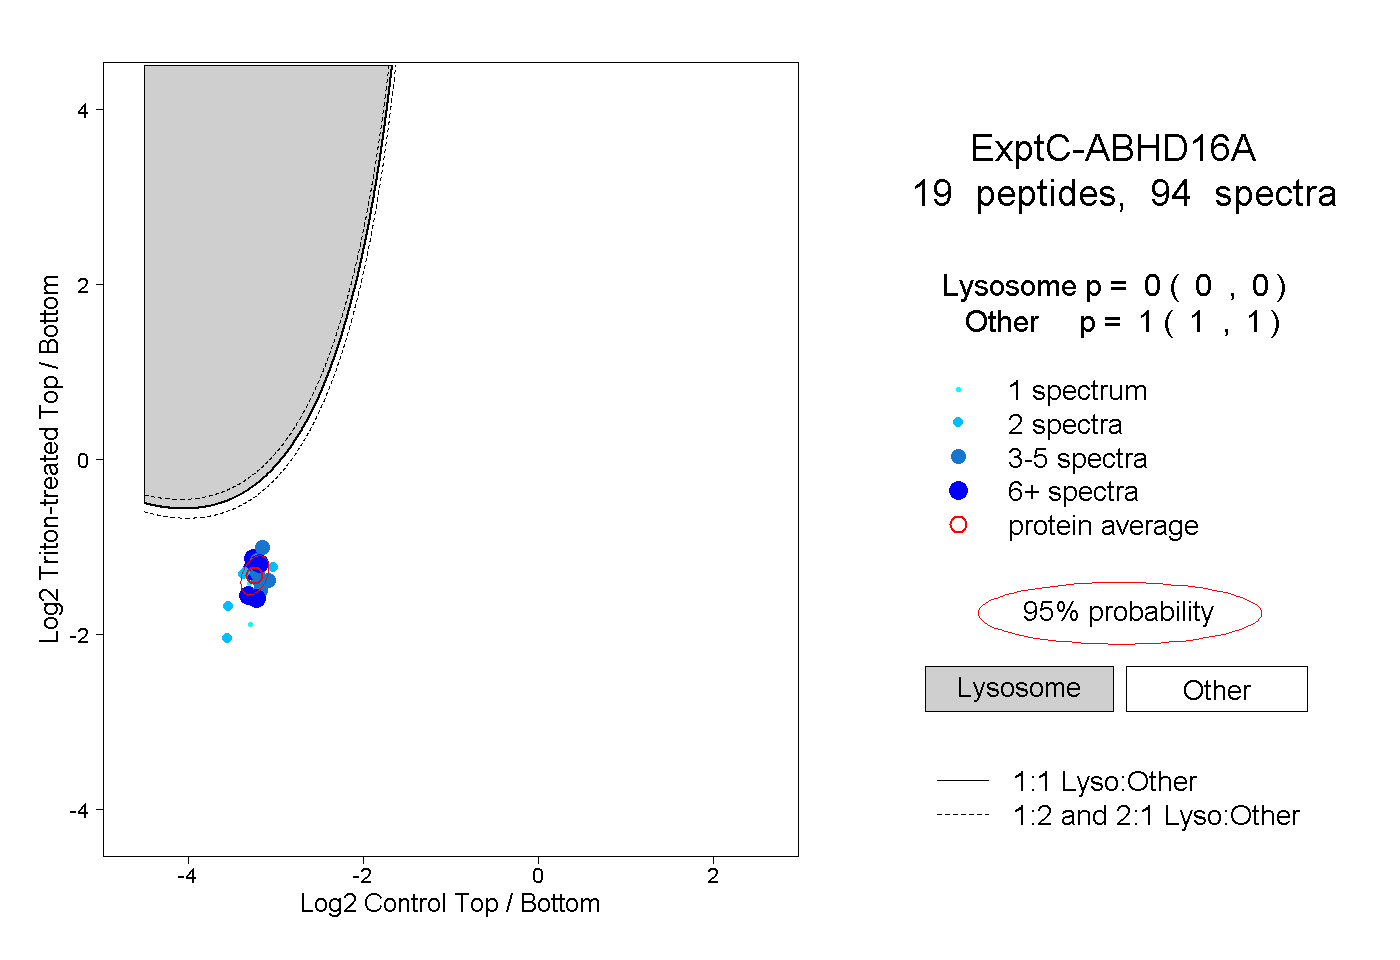
0.000 | 0.000
1.000 | 1.000
3peptides
spectra
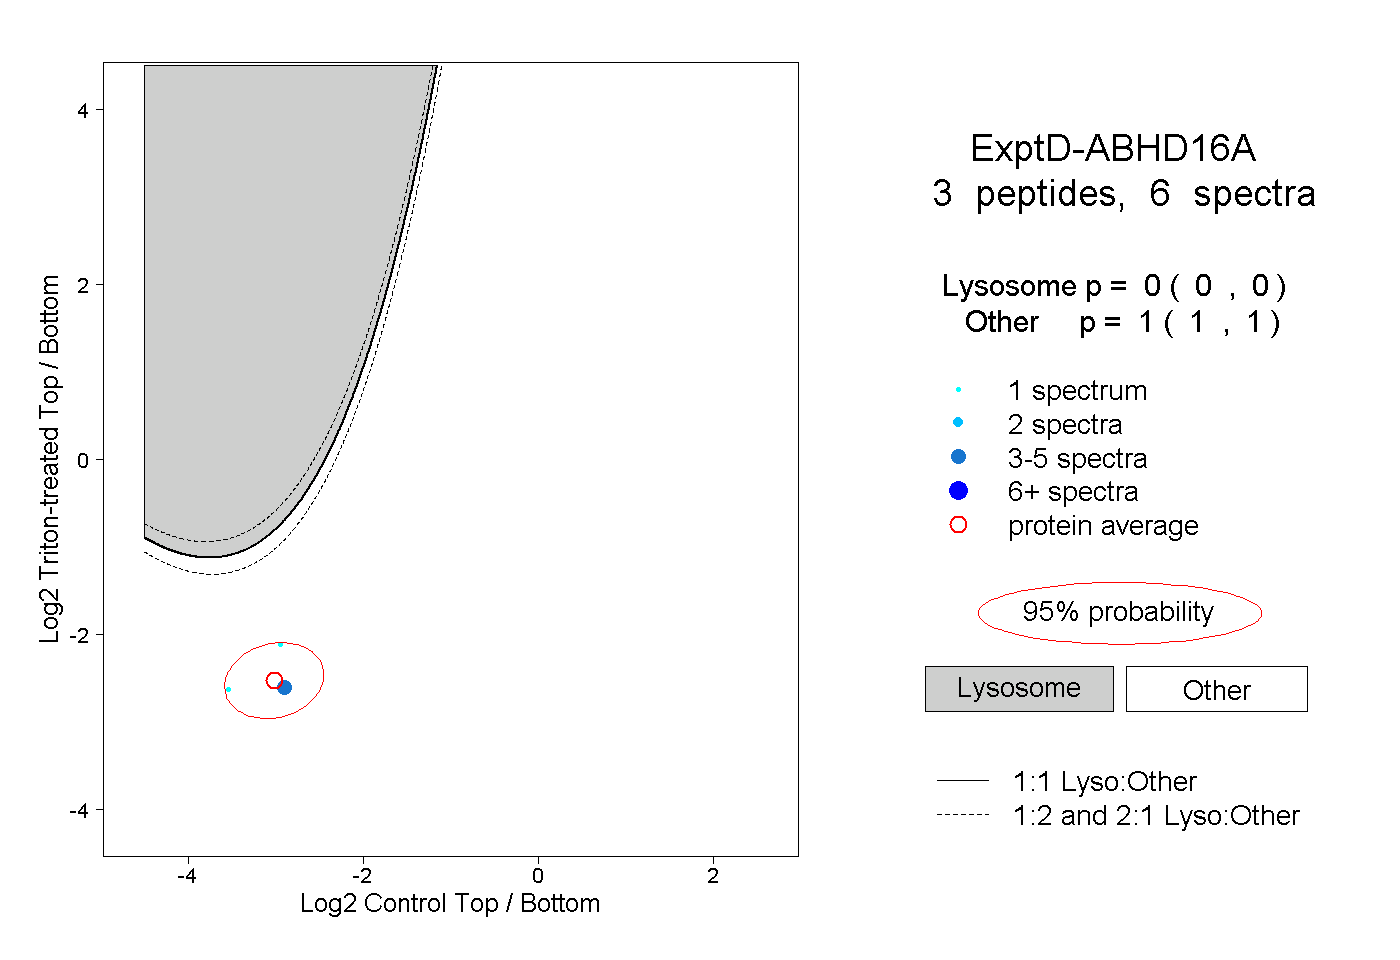
0.000 | 0.000
1.000 | 1.000