 13
13peptides
spectra
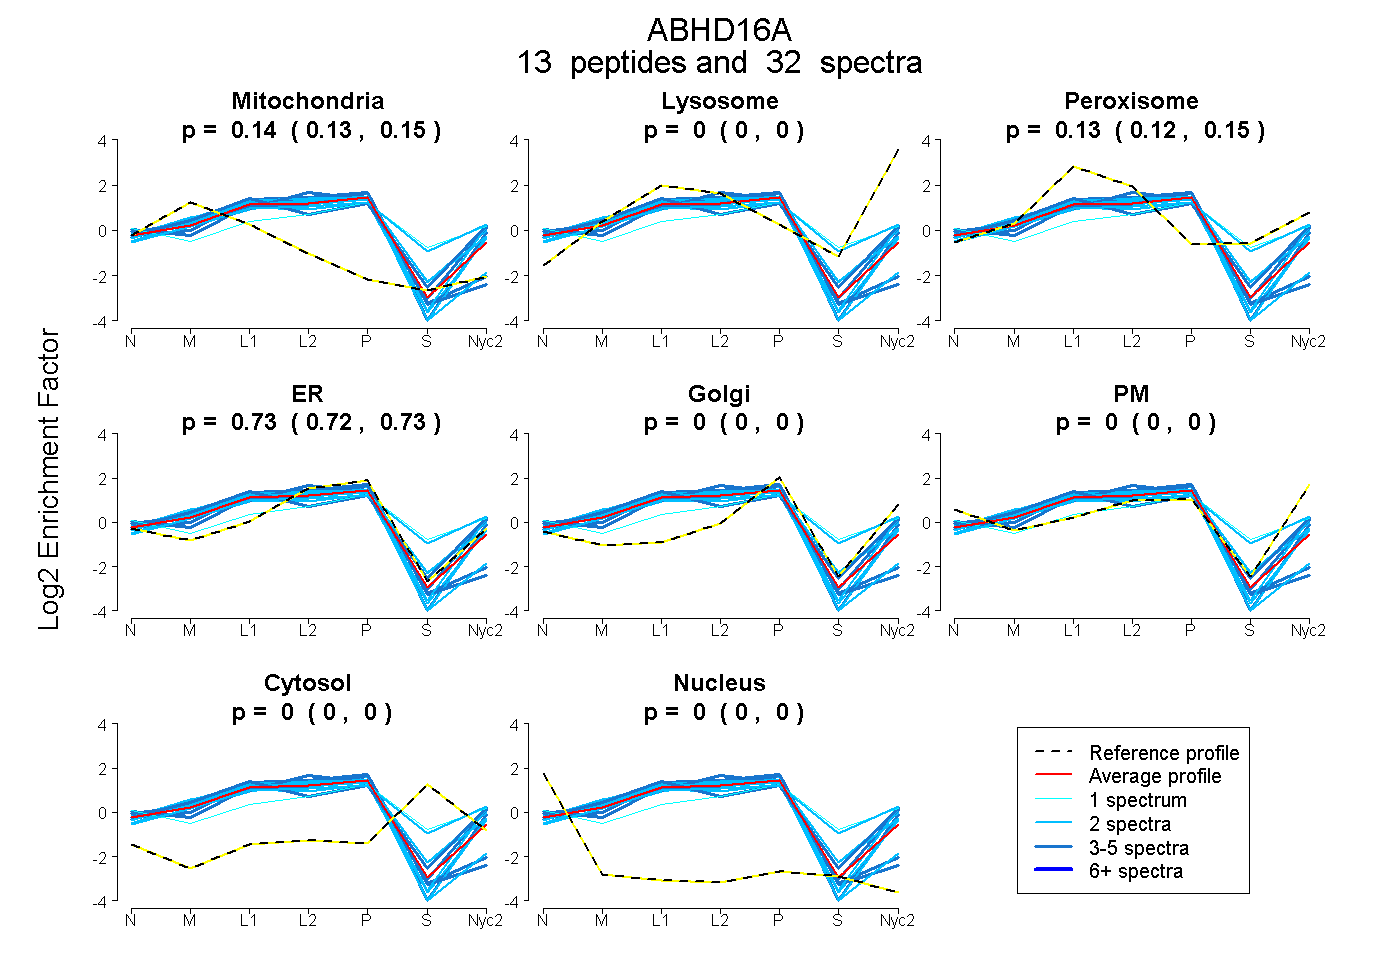
0.128 | 0.149
0.000 | 0.000
0.117 | 0.146
0.719 | 0.734
0.000 | 0.000
0.000 | 0.000
0.000 | 0.000
0.000 | 0.000
| Plot | Mito | Lyso | Perox | ER | Golgi | PM | Cytosol | Nucleus | |||||
| Expt A |
13 peptides |
32 spectra |
|
0.140 0.128 | 0.149 |
0.000 0.000 | 0.000 |
0.133 0.117 | 0.146 |
0.727 0.719 | 0.734 |
0.000 0.000 | 0.000 |
0.000 0.000 | 0.000 |
0.000 0.000 | 0.000 |
0.000 0.000 | 0.000 |
| 2 spectra, QLANYNFDFR | 0.114 | 0.128 | 0.000 | 0.683 | 0.000 | 0.075 | 0.000 | 0.000 | ||
| 2 spectra, VMTEEGLR | 0.000 | 0.000 | 0.471 | 0.203 | 0.297 | 0.000 | 0.028 | 0.000 | ||
| 1 spectrum, VMPDSWR | 0.000 | 0.000 | 0.285 | 0.249 | 0.272 | 0.052 | 0.142 | 0.000 | ||
| 3 spectra, MLYPGSVYLLQK | 0.231 | 0.000 | 0.000 | 0.769 | 0.000 | 0.000 | 0.000 | 0.000 | ||
| 2 spectra, FQGPVLLVR | 0.062 | 0.013 | 0.218 | 0.633 | 0.000 | 0.074 | 0.000 | 0.000 | ||
| 2 spectra, QFITILEATHR | 0.268 | 0.000 | 0.000 | 0.732 | 0.000 | 0.000 | 0.000 | 0.000 | ||
| 2 spectra, GTADTFLNR | 0.238 | 0.067 | 0.000 | 0.668 | 0.000 | 0.028 | 0.000 | 0.000 | ||
| 4 spectra, GVALLRPEPLHR | 0.200 | 0.000 | 0.000 | 0.800 | 0.000 | 0.000 | 0.000 | 0.000 | ||
| 4 spectra, QLALFLAR | 0.055 | 0.022 | 0.148 | 0.636 | 0.000 | 0.139 | 0.000 | 0.000 | ||
| 3 spectra, SYQAEHGPDFPWSVGEDMSVDGR | 0.167 | 0.127 | 0.125 | 0.459 | 0.000 | 0.121 | 0.000 | 0.000 | ||
| 2 spectra, LLACDGNEIDTMFVDR | 0.143 | 0.078 | 0.000 | 0.779 | 0.000 | 0.000 | 0.000 | 0.000 | ||
| 3 spectra, ALMPVLLQGQAR | 0.124 | 0.099 | 0.000 | 0.777 | 0.000 | 0.000 | 0.000 | 0.000 | ||
| 2 spectra, SWPVDFHWEEPSSR | 0.100 | 0.000 | 0.264 | 0.636 | 0.000 | 0.000 | 0.000 | 0.000 |
| Plot | Mito | Lyso or Perox | ER | Golgi | PM | Cytosol | Nucleus | ||||||
| Expt B |
8 peptides |
13 spectra |
 |
0.159 0.110 | 0.198 |
0.324 0.234 | 0.395 |
0.202 0.032 | 0.328 |
0.304 0.166 | 0.414 |
0.011 0.000 | 0.043 |
0.000 0.000 | 0.000 |
0.000 0.000 | 0.000 |
|||
| Plot | Lyso | Other | |||||||||||
| Expt C |
19 peptides |
94 spectra |
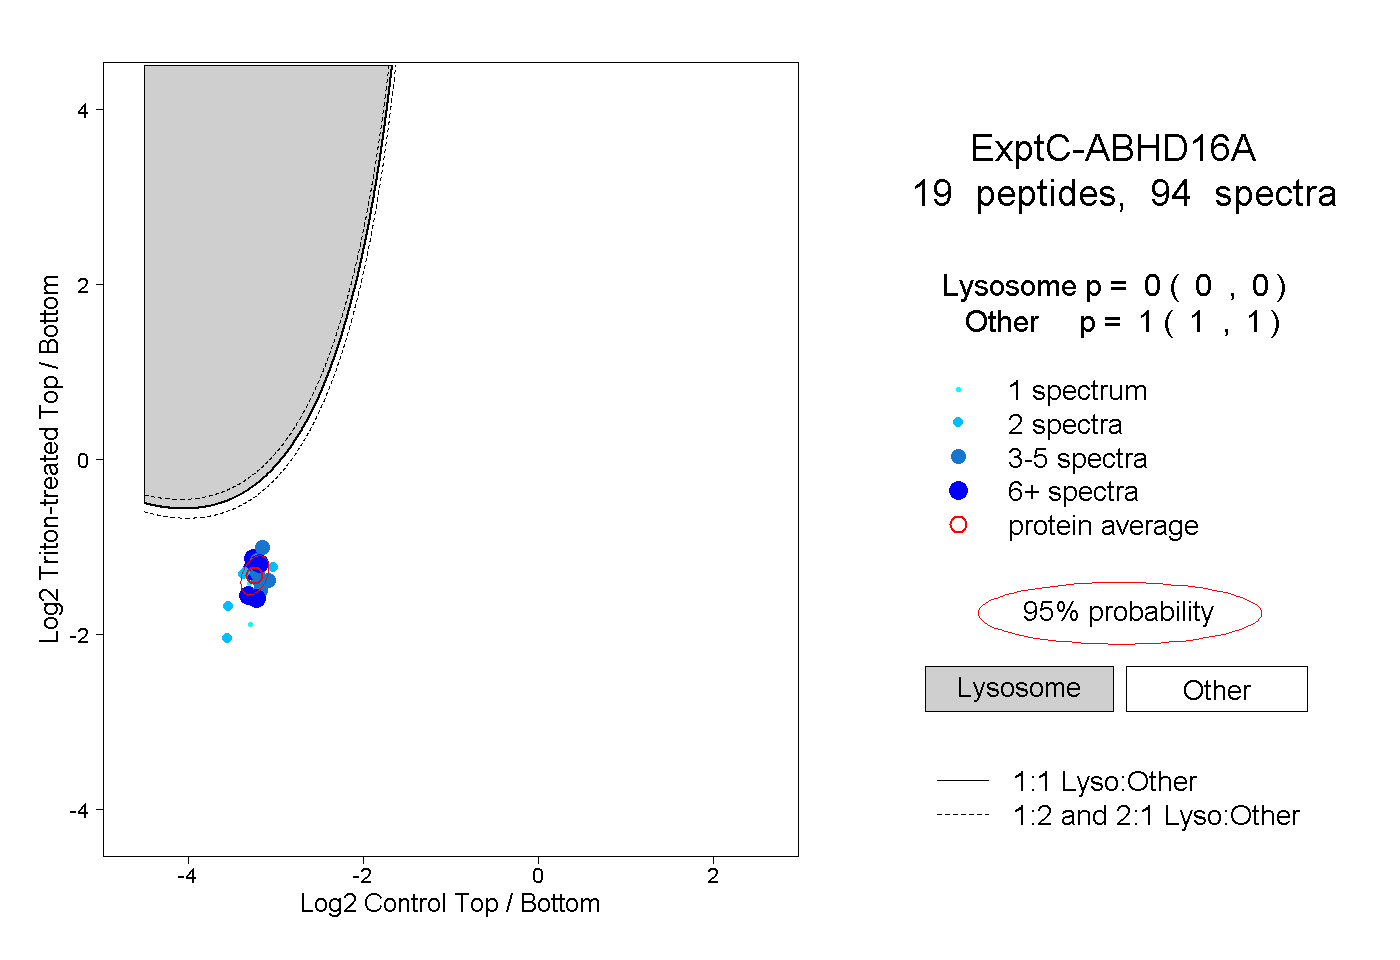 |
0.000 0.000 | 0.000 |
1.000 1.000 | 1.000 |
||||||||
| Plot | Lyso | Other | |||||||||||
| Expt D |
3 peptides |
6 spectra |
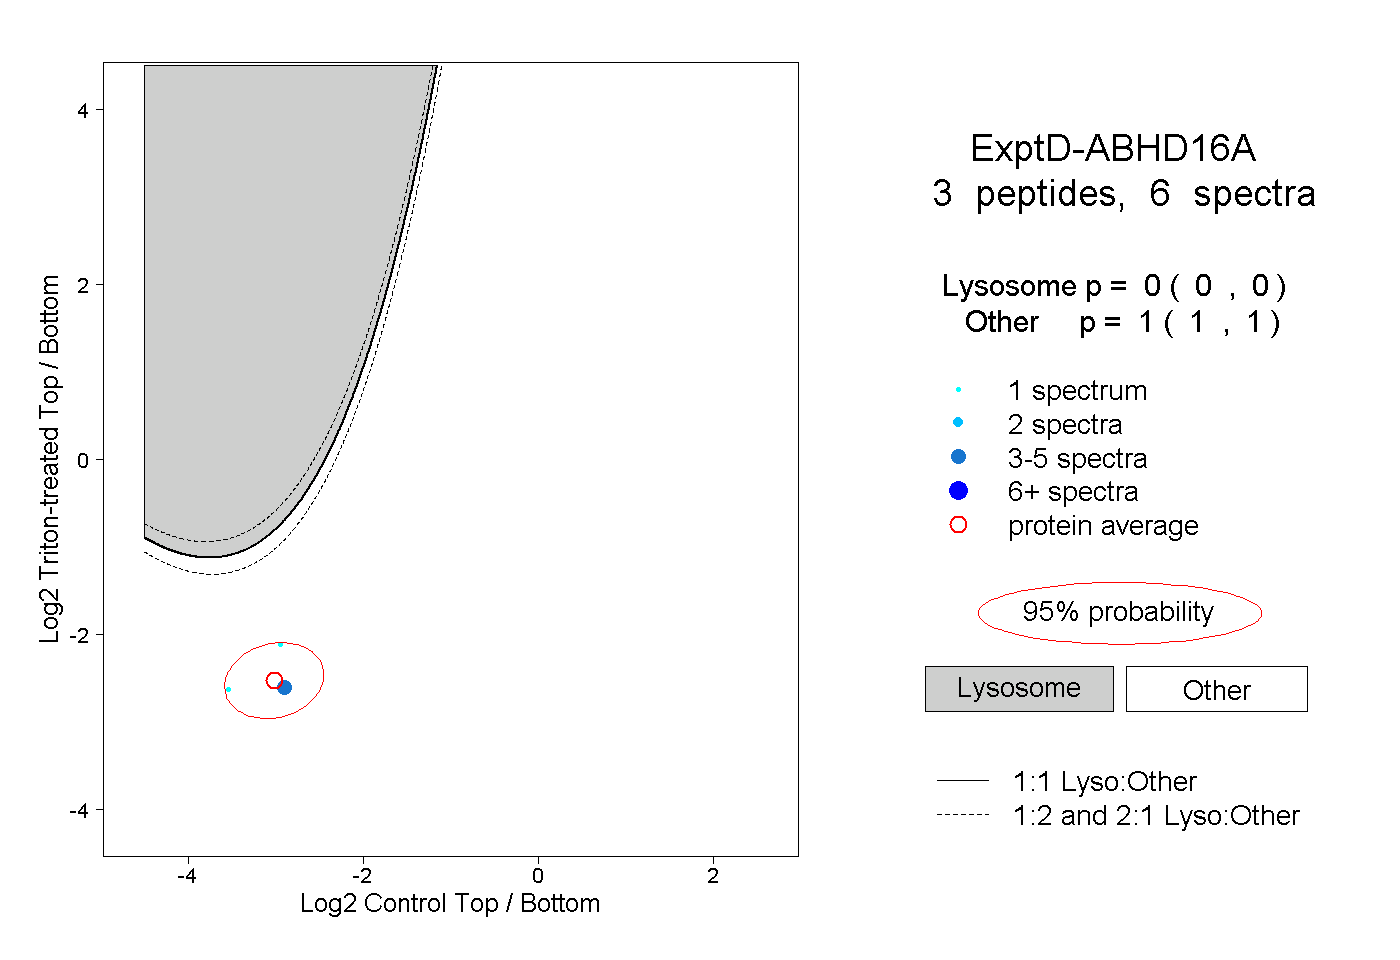 |
0.000 0.000 | 0.000 |
1.000 1.000 | 1.000 |