 6
6peptides
spectra
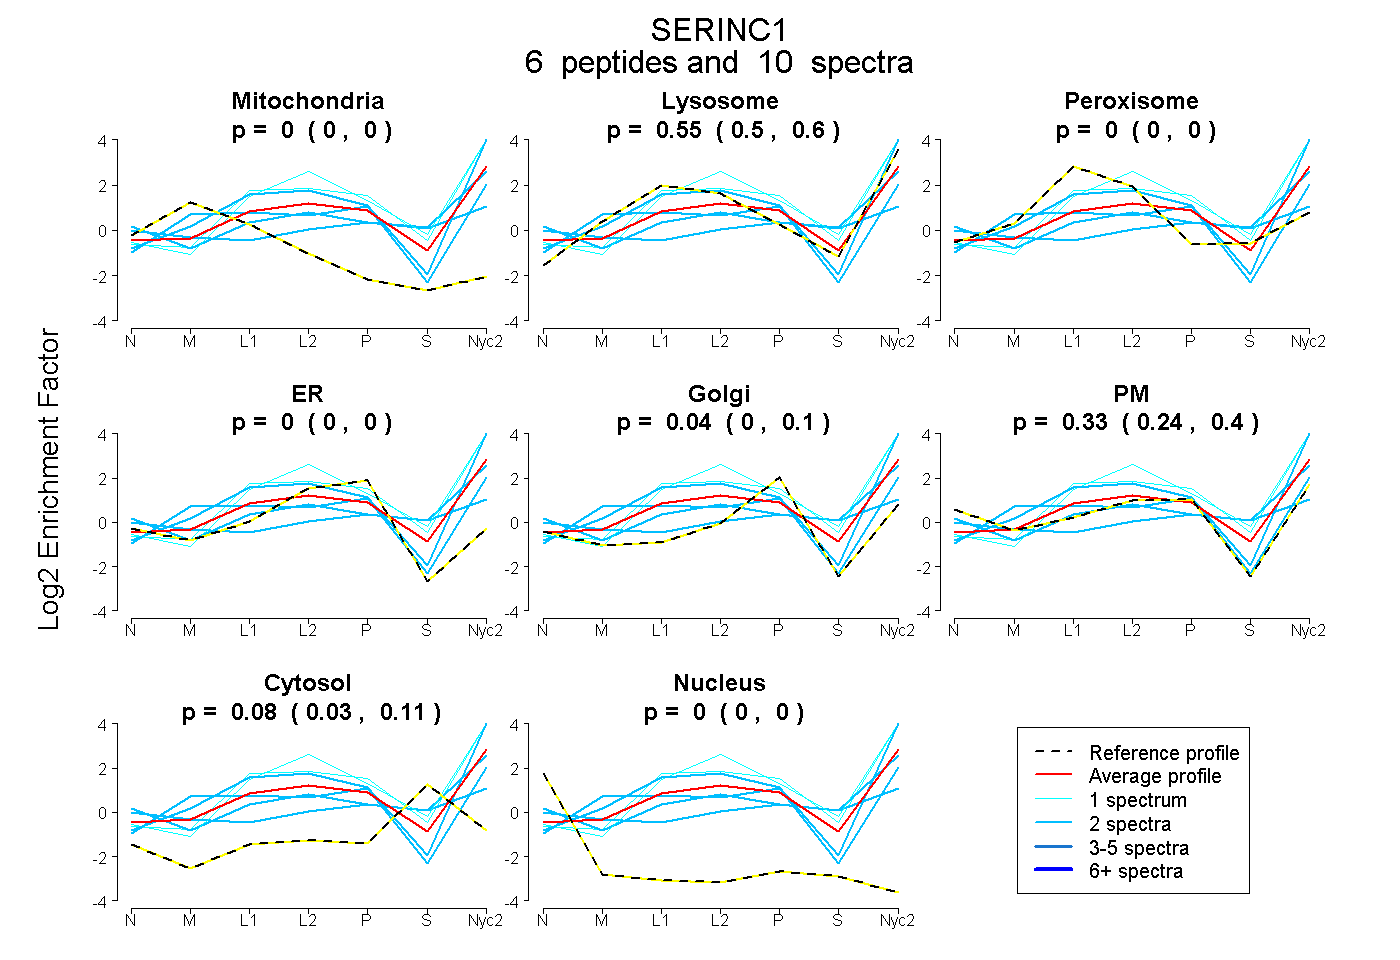
0.000 | 0.000
0.496 | 0.600
0.000 | 0.000
0.000 | 0.000
0.000 | 0.104
0.243 | 0.395
0.030 | 0.113
0.000 | 0.000
2peptides
spectra
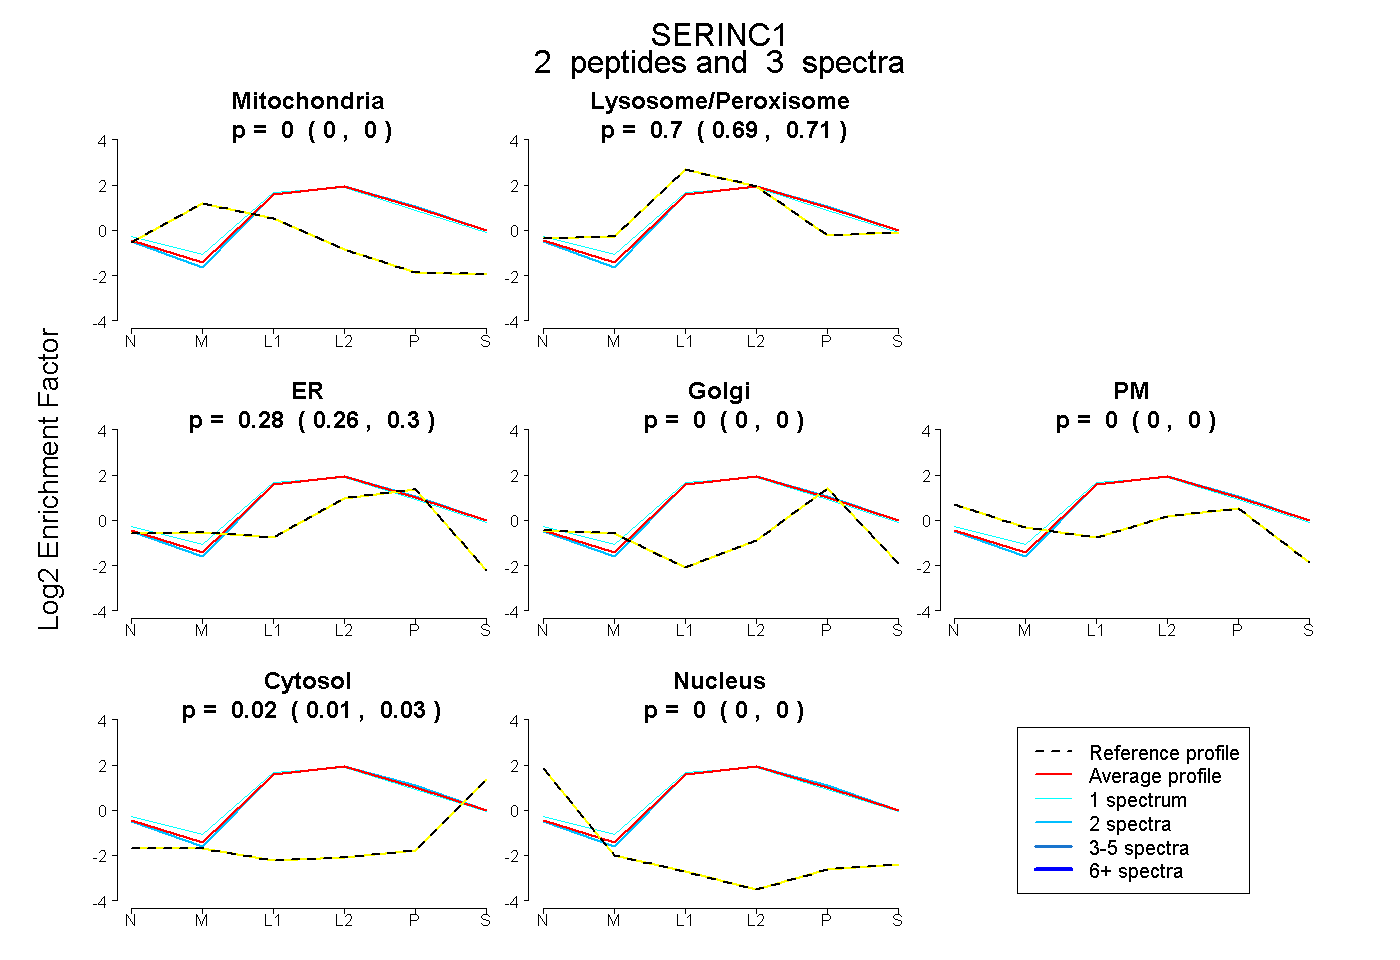
0.000 | 0.000
0.685 | 0.712
0.262 | 0.296
0.000 | 0.000
0.000 | 0.000
0.006 | 0.031
0.000 | 0.000
6peptides
spectra
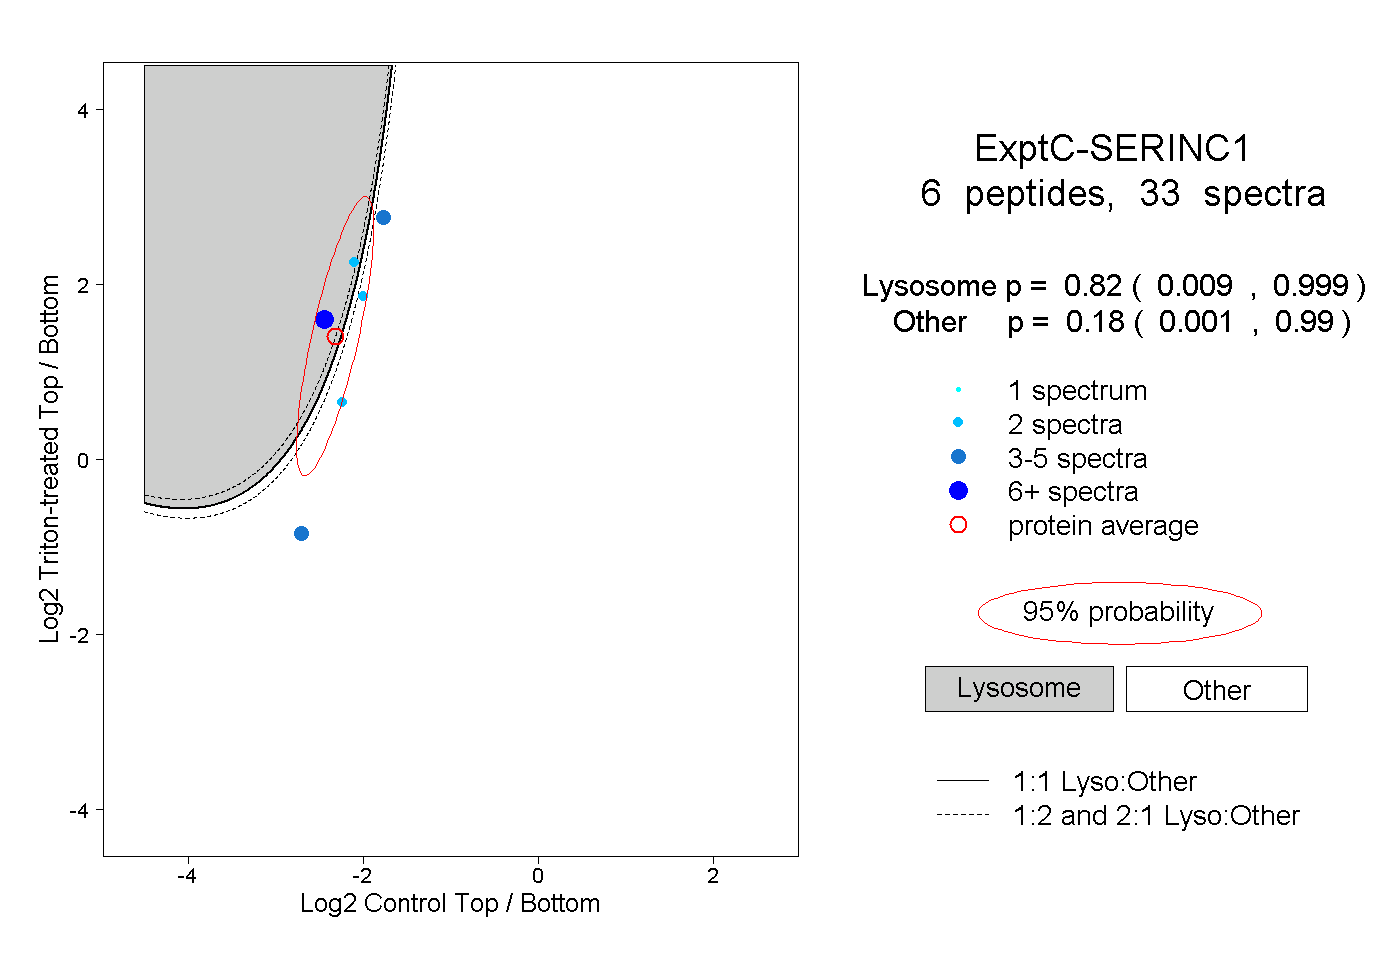
0.009 | 0.999
0.001 | 0.990
3peptides
spectra
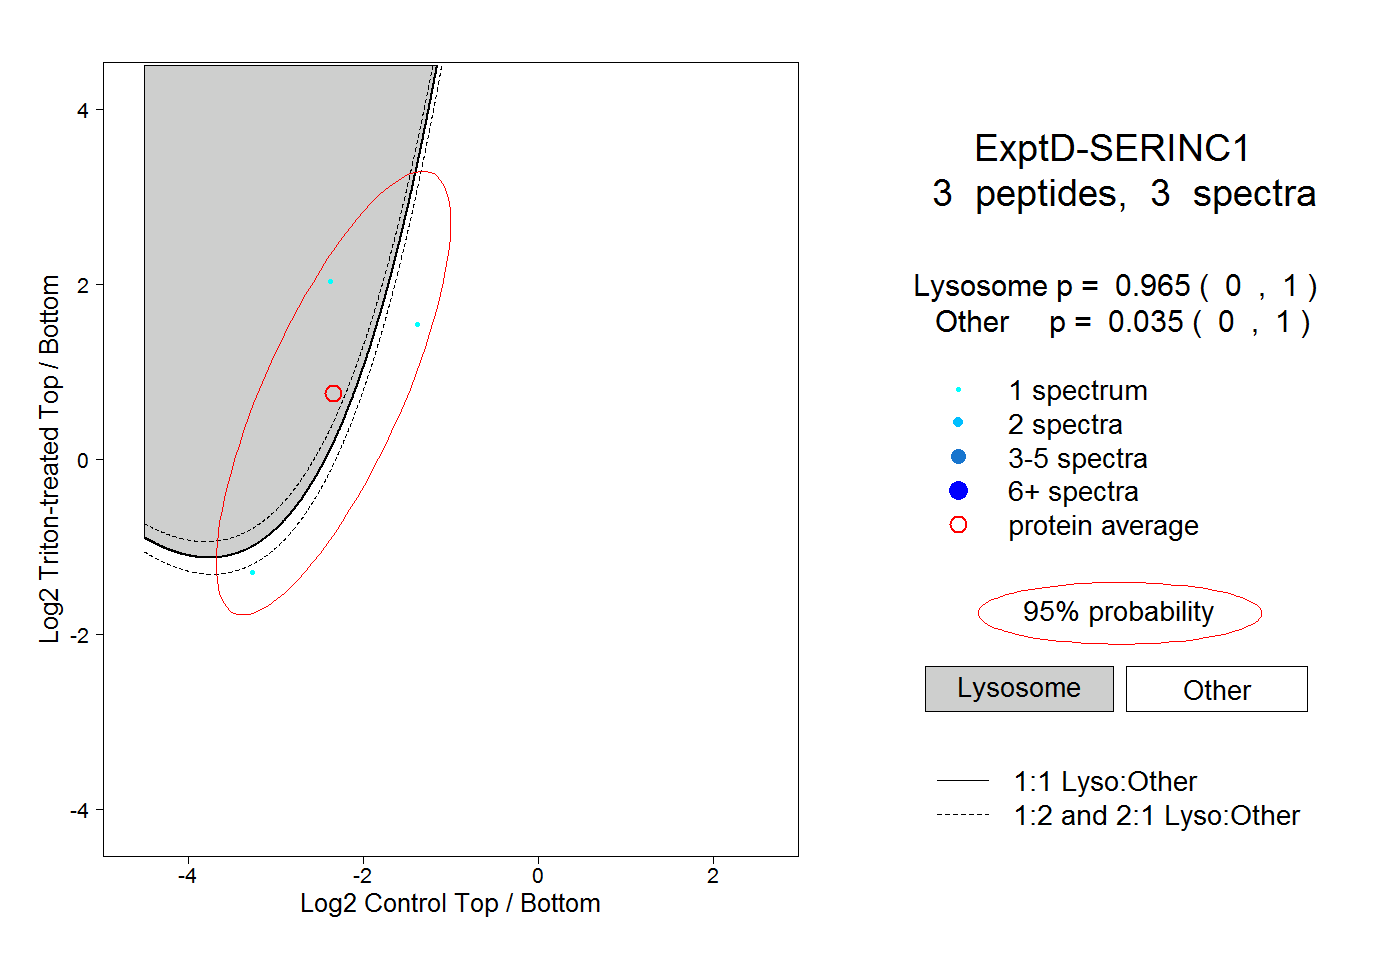
0.000 | 1.000
0.000 | 1.000