 6
6peptides
spectra
0.000 | 0.000
0.496 | 0.600
0.000 | 0.000
0.000 | 0.000
0.000 | 0.104
0.243 | 0.395
0.030 | 0.113
0.000 | 0.000
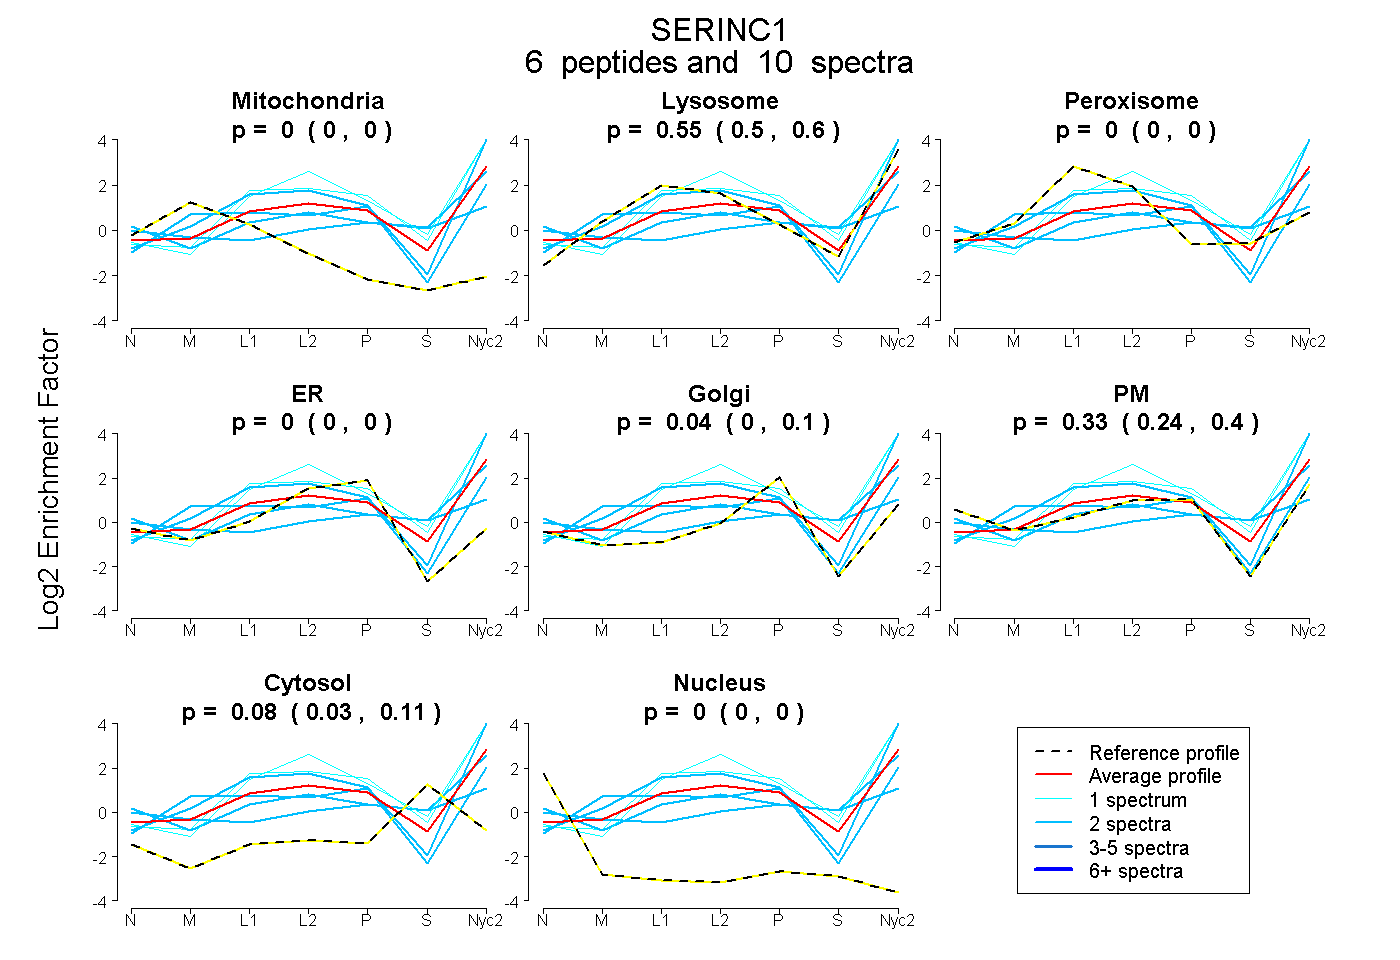
| Plot | Mito | Lyso | Perox | ER | Golgi | PM | Cytosol | Nucleus | |||||
| Expt A |
6 peptides |
10 spectra |
|
0.000 0.000 | 0.000 |
0.550 0.496 | 0.600 |
0.000 0.000 | 0.000 |
0.000 0.000 | 0.000 |
0.036 0.000 | 0.104 |
0.334 0.243 | 0.395 |
0.080 0.030 | 0.113 |
0.000 0.000 | 0.000 |
| 2 spectra, GVVPCNILVGYK | 0.101 | 0.492 | 0.000 | 0.000 | 0.314 | 0.093 | 0.000 | 0.000 | ||
| 1 spectrum, AVDNER | 0.000 | 0.848 | 0.000 | 0.000 | 0.042 | 0.110 | 0.000 | 0.000 | ||
| 2 spectra, CCPSGNNSTVTR | 0.000 | 0.143 | 0.009 | 0.000 | 0.000 | 0.450 | 0.399 | 0.000 | ||
| 2 spectra, IQESQPR | 0.000 | 0.427 | 0.000 | 0.000 | 0.000 | 0.319 | 0.254 | 0.000 | ||
| 2 spectra, SQWTAVWVK | 0.000 | 0.772 | 0.000 | 0.000 | 0.000 | 0.228 | 0.000 | 0.000 | ||
| 1 spectrum, SDGSLDDGEGVHR | 0.000 | 0.846 | 0.000 | 0.000 | 0.000 | 0.154 | 0.000 | 0.000 |
| Plot | Mito | Lyso or Perox | ER | Golgi | PM | Cytosol | Nucleus | ||||||
| Expt B |
2 peptides |
3 spectra |
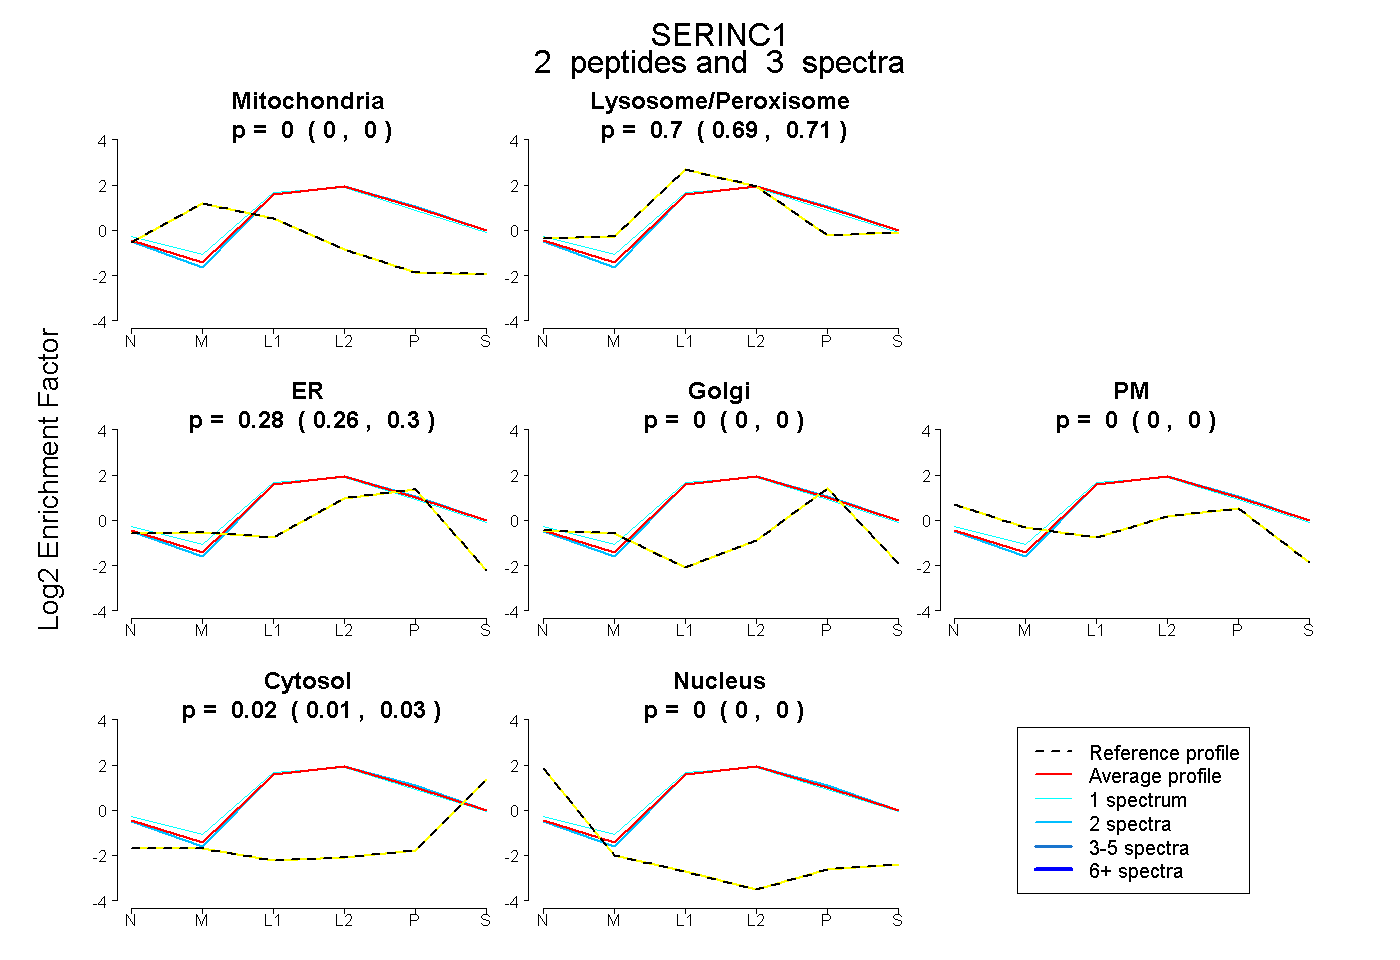 |
0.000 0.000 | 0.000 |
0.700 0.685 | 0.712 |
0.281 0.262 | 0.296 |
0.000 0.000 | 0.000 |
0.000 0.000 | 0.000 |
0.020 0.006 | 0.031 |
0.000 0.000 | 0.000 |
|||
| Plot | Lyso | Other | |||||||||||
| Expt C |
6 peptides |
33 spectra |
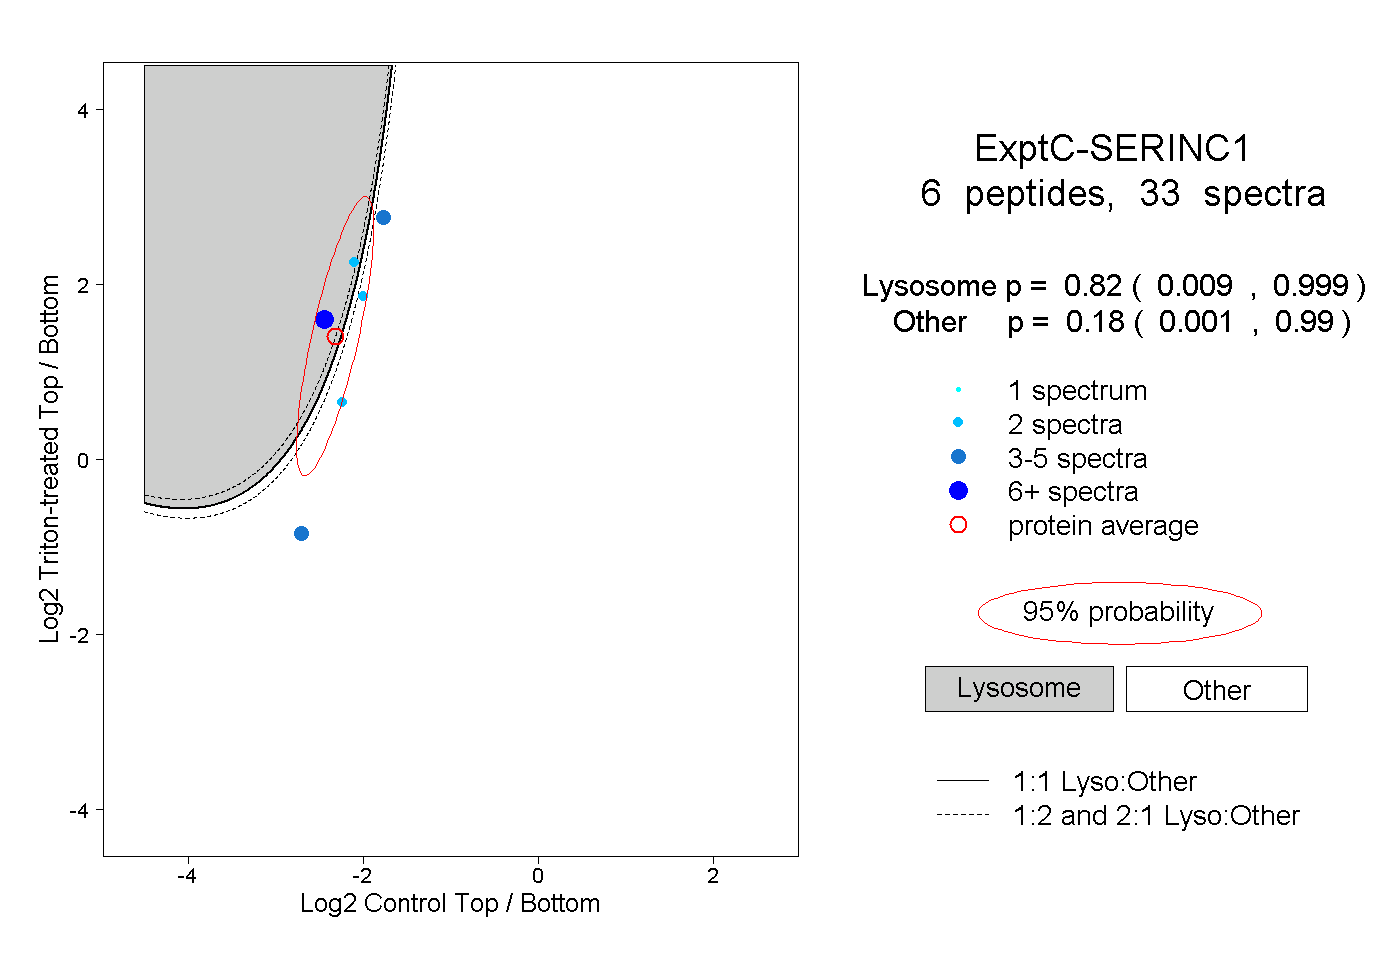 |
0.820 0.009 | 0.999 |
0.180 0.001 | 0.990 |
||||||||
| Plot | Lyso | Other | |||||||||||
| Expt D |
3 peptides |
3 spectra |
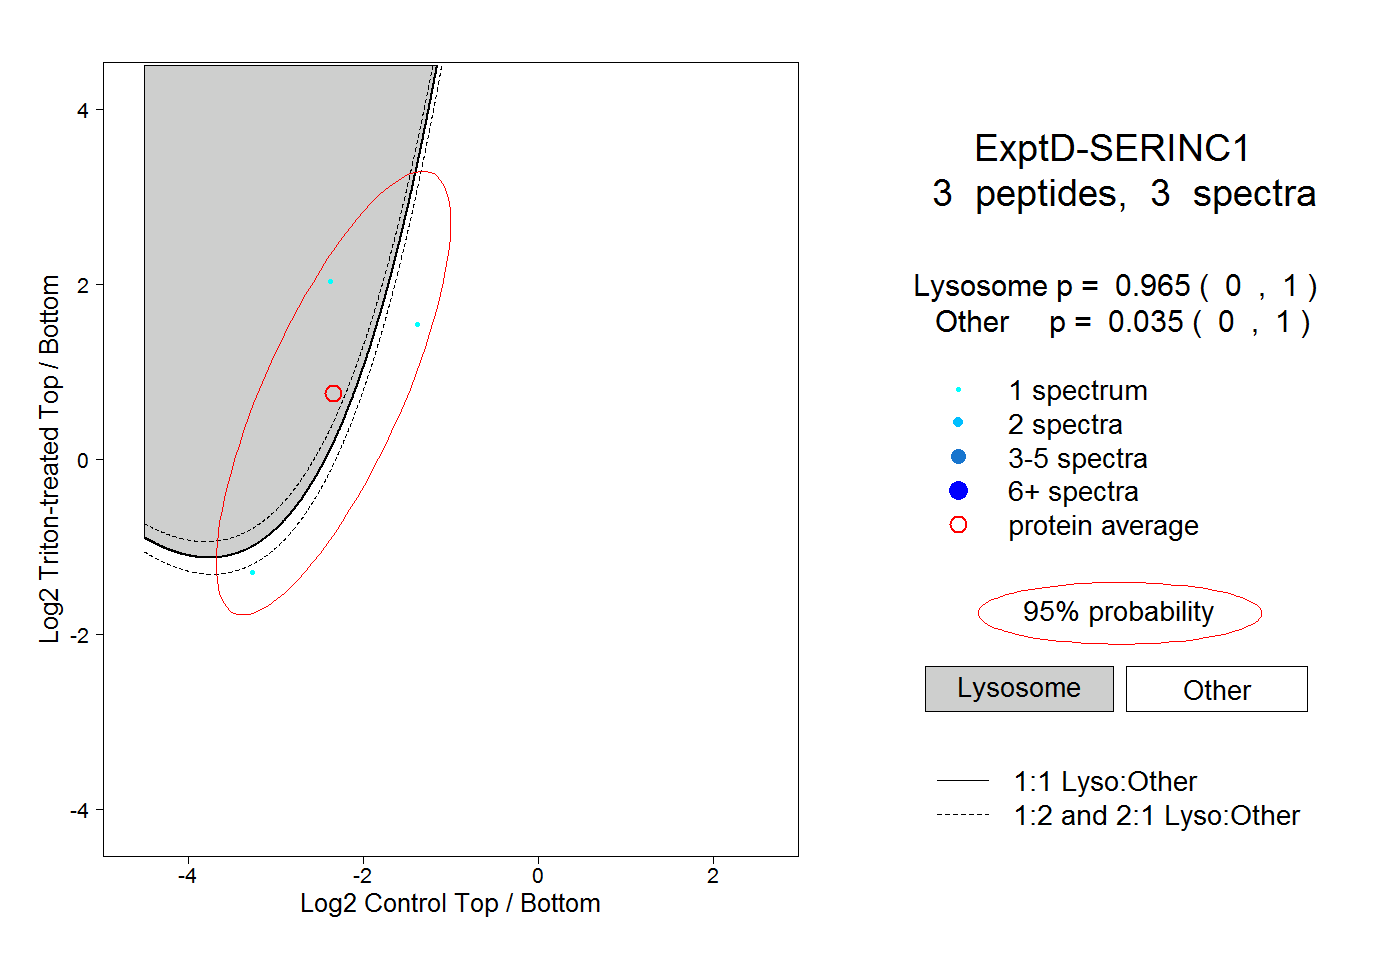 |
0.965 0.000 | 1.000 |
0.035 0.000 | 1.000 |