 14
14peptides
spectra
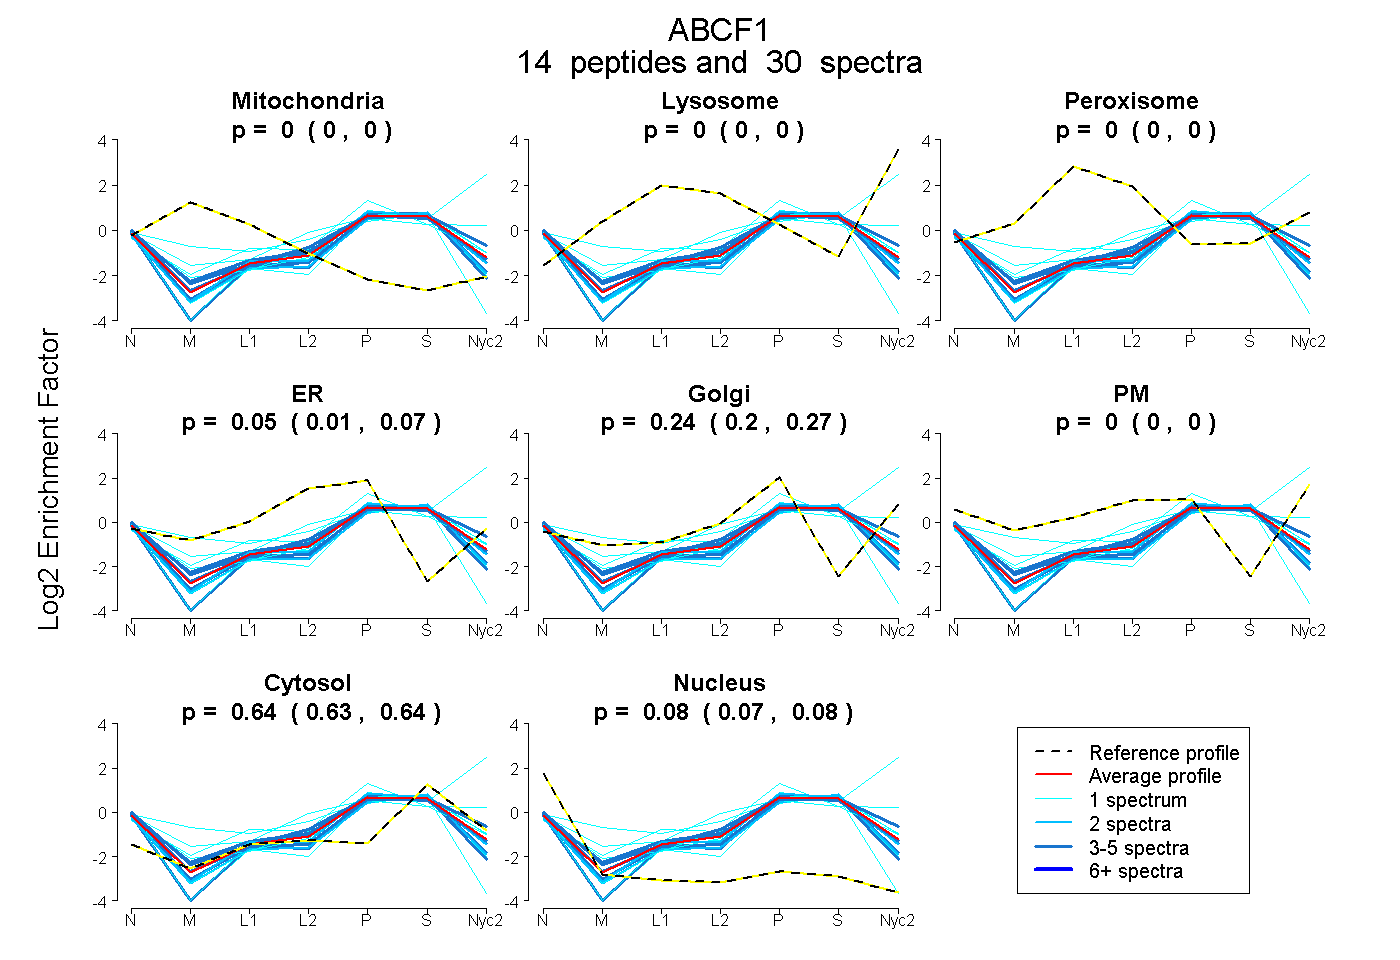
0.000 | 0.000
0.000 | 0.000
0.000 | 0.000
0.014 | 0.074
0.199 | 0.274
0.000 | 0.000
0.632 | 0.640
0.067 | 0.085
6peptides
spectra
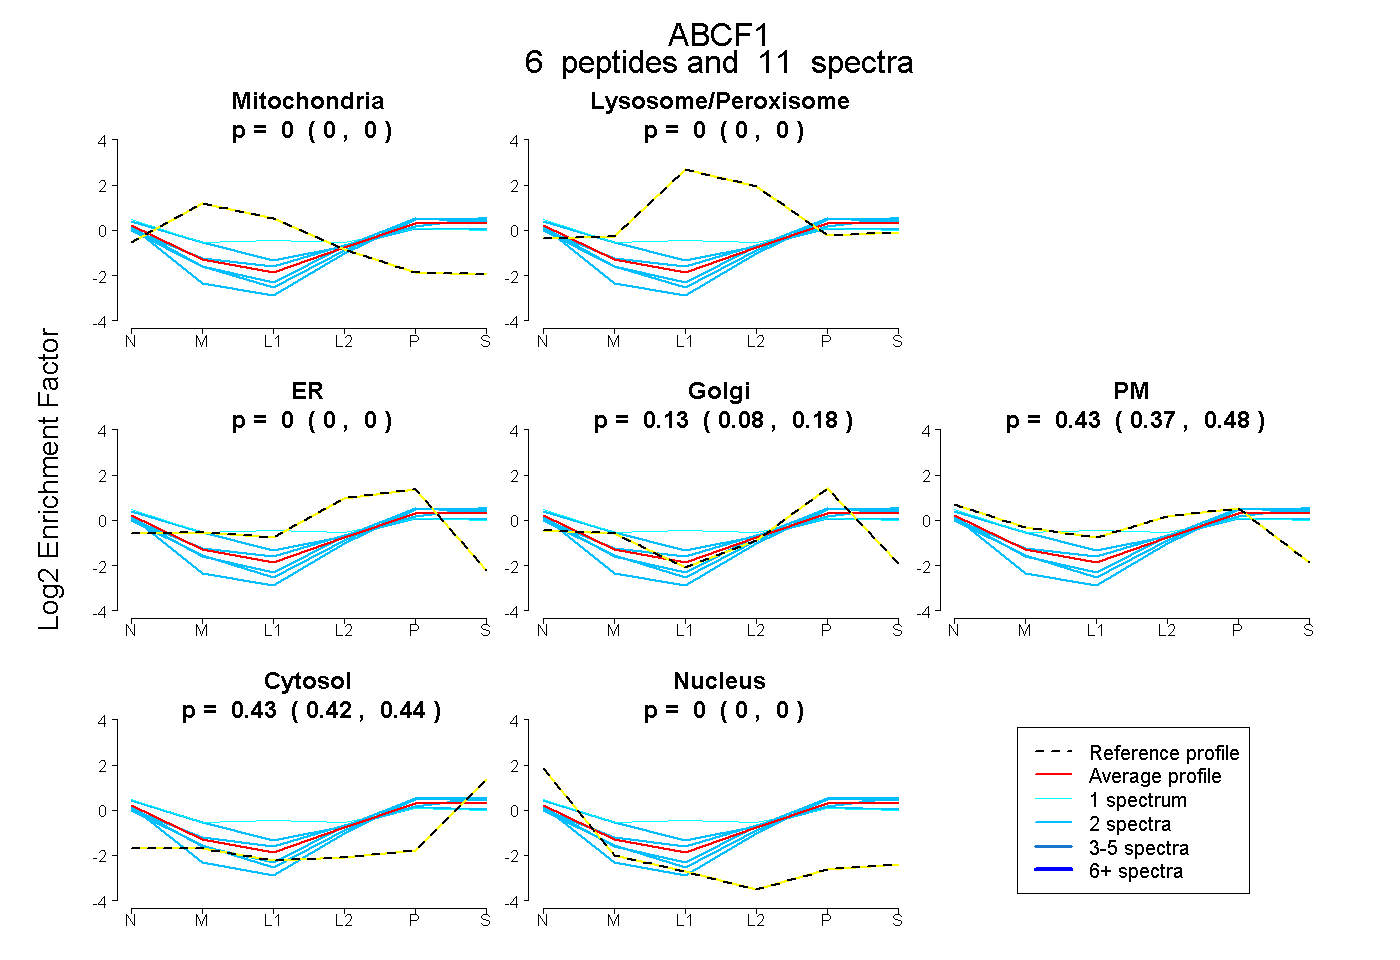
0.000 | 0.000
0.000 | 0.000
0.000 | 0.000
0.082 | 0.183
0.374 | 0.480
0.418 | 0.443
0.000 | 0.000
8peptides
spectra
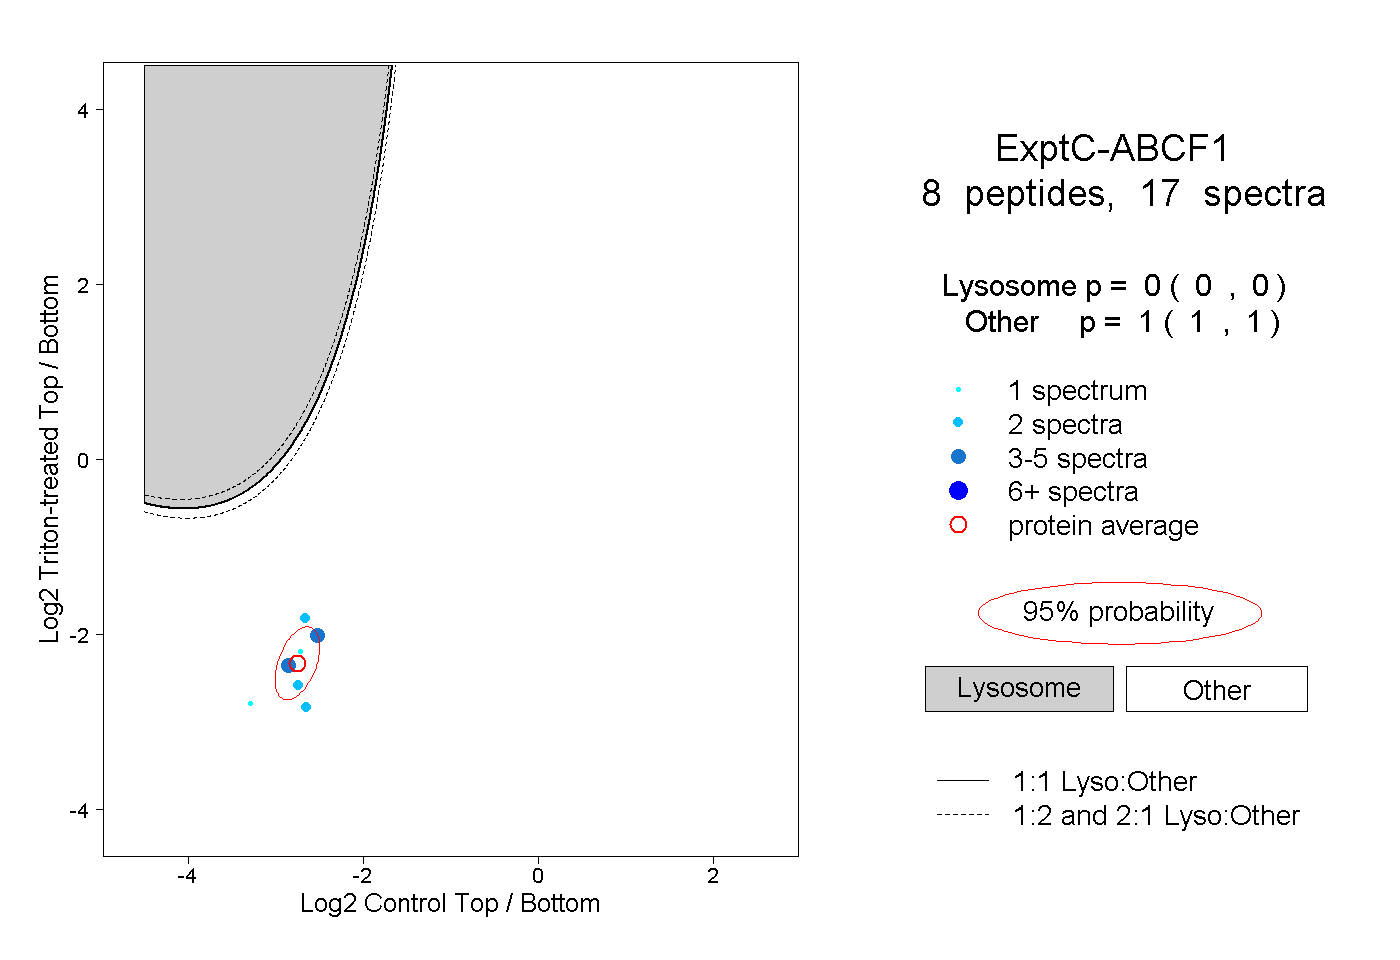
0.000 | 0.000
1.000 | 1.000
4peptides
spectra
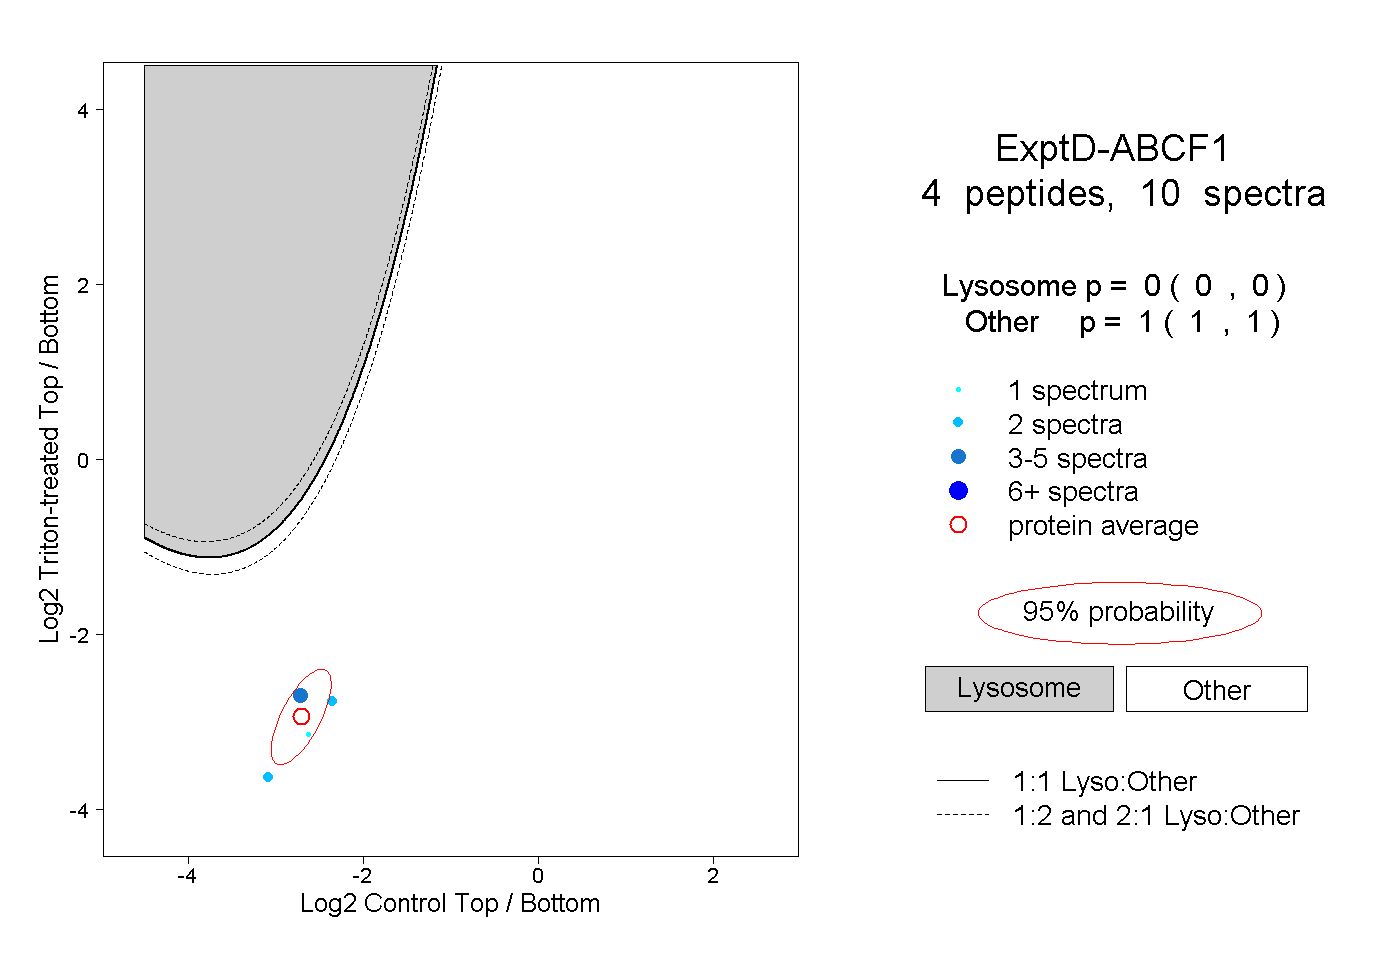
0.000 | 0.000
1.000 | 1.000