ABCF1
[ENSRNOP00000001049]
Main page
| | | Plot |
Mito |
Lyso |
|
Perox |
ER |
Golgi |
PM |
Cytosol |
Nucleus |
|
| Expt A |
 14
14
peptides |
30
spectra |
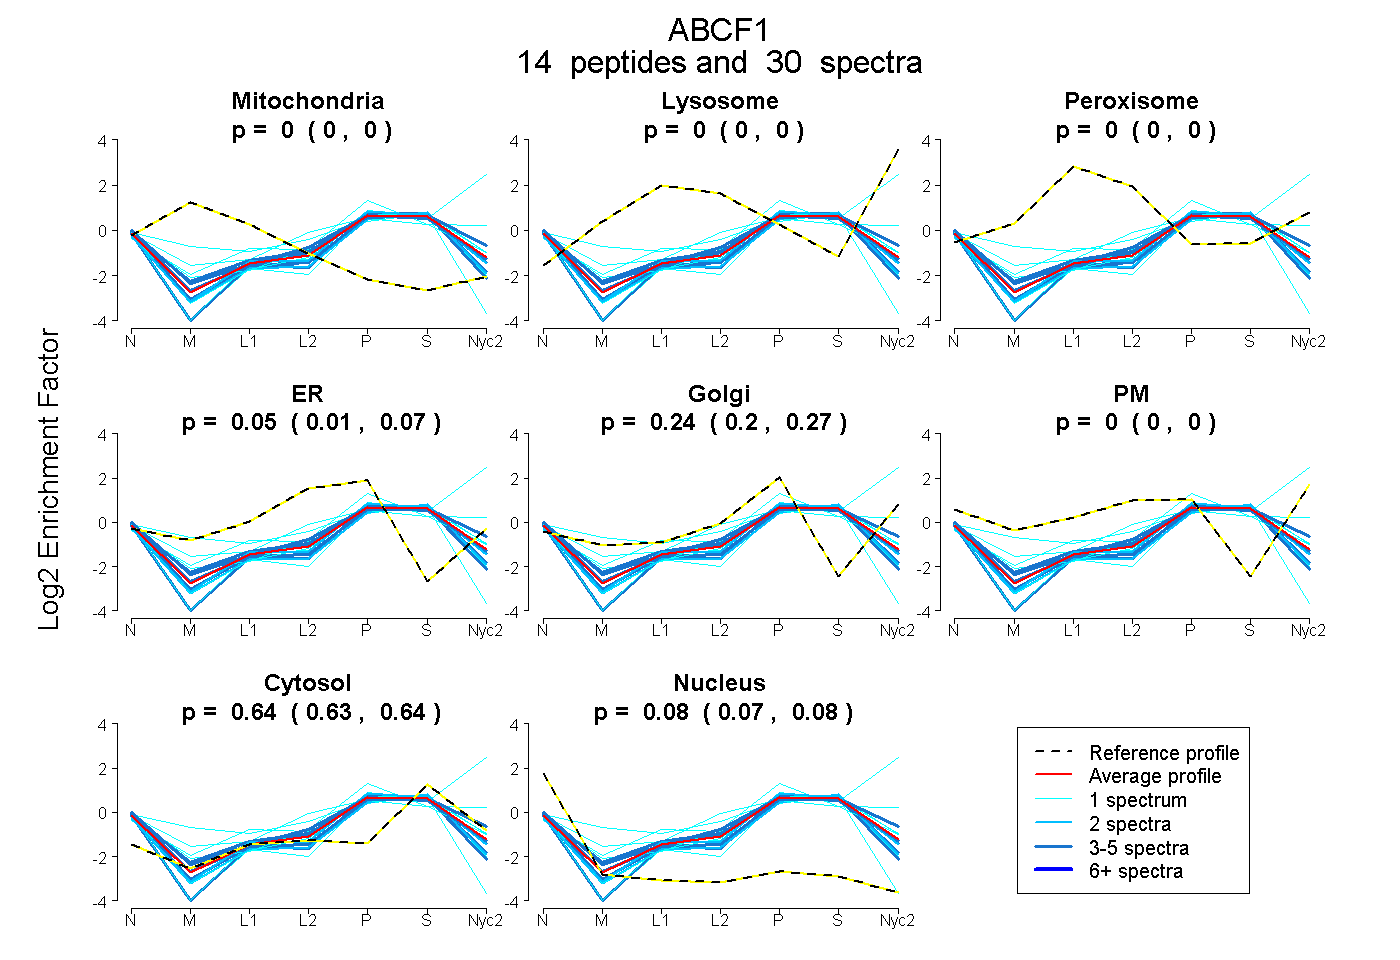 |
0.000
0.000 | 0.000 |
0.000
0.000 | 0.000 |
|
0.000
0.000 | 0.000 |
0.046
0.014 | 0.074 |
0.241
0.199 | 0.274 |
0.000
0.000 | 0.000 |
0.636
0.632 | 0.640 |
0.077
0.067 | 0.085 |
|
| | | Plot |
Mito |
|
Lyso or Perox |
|
ER |
Golgi |
PM |
Cytosol |
Nucleus |
|
| Expt B |
6
peptides |
11
spectra |
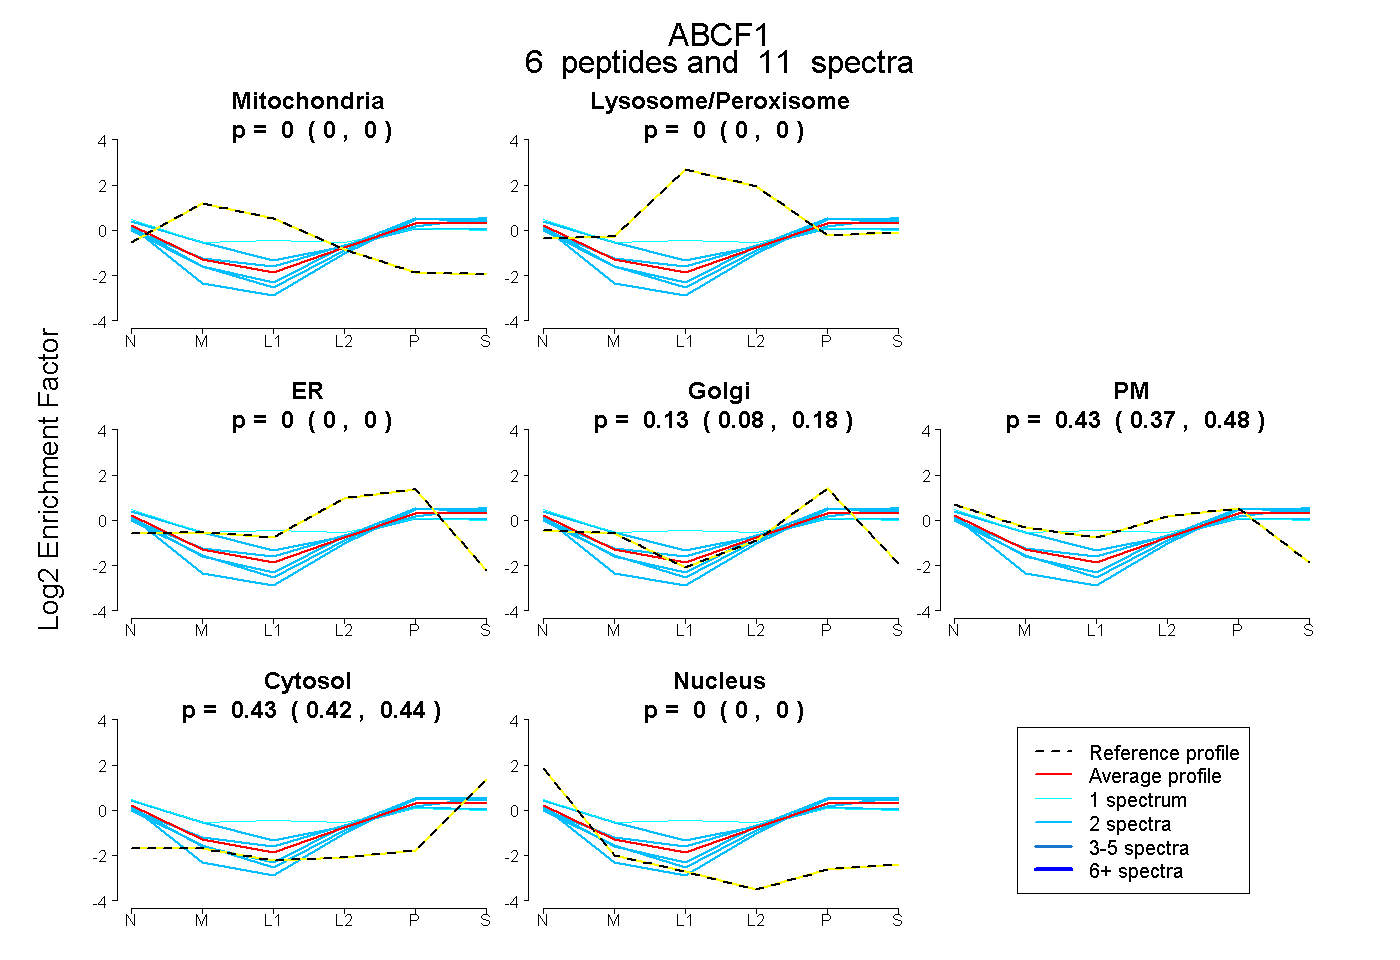 |
0.000
0.000 | 0.000 |
|
0.000
0.000 | 0.000 |
|
0.000
0.000 | 0.000 |
0.134
0.082 | 0.183 |
0.434
0.374 | 0.480 |
0.432
0.418 | 0.443 |
0.000
0.000 | 0.000 |
|
| 1 spectrum, ICIVGPNGVGK |
0.000 |
|
0.181 |
|
0.000 |
0.000 |
0.525 |
0.283 |
0.011 |
|
| 2 spectra, STLLLLLTGK |
0.000 |
|
0.050 |
|
0.000 |
0.082 |
0.402 |
0.467 |
0.000 |
|
| 2 spectra, GAVIVVSHDAR |
0.000 |
|
0.010 |
|
0.000 |
0.000 |
0.631 |
0.359 |
0.000 |
|
| 2 spectra, VYEELR |
0.000 |
|
0.000 |
|
0.000 |
0.322 |
0.248 |
0.430 |
0.000 |
|
| 2 spectra, GFNLPYQDAR |
0.000 |
|
0.000 |
|
0.000 |
0.396 |
0.144 |
0.460 |
0.000 |
|
| 2 spectra, EVLTR |
0.000 |
|
0.000 |
|
0.000 |
0.492 |
0.000 |
0.473 |
0.034 |
|
| | | Plot |
|
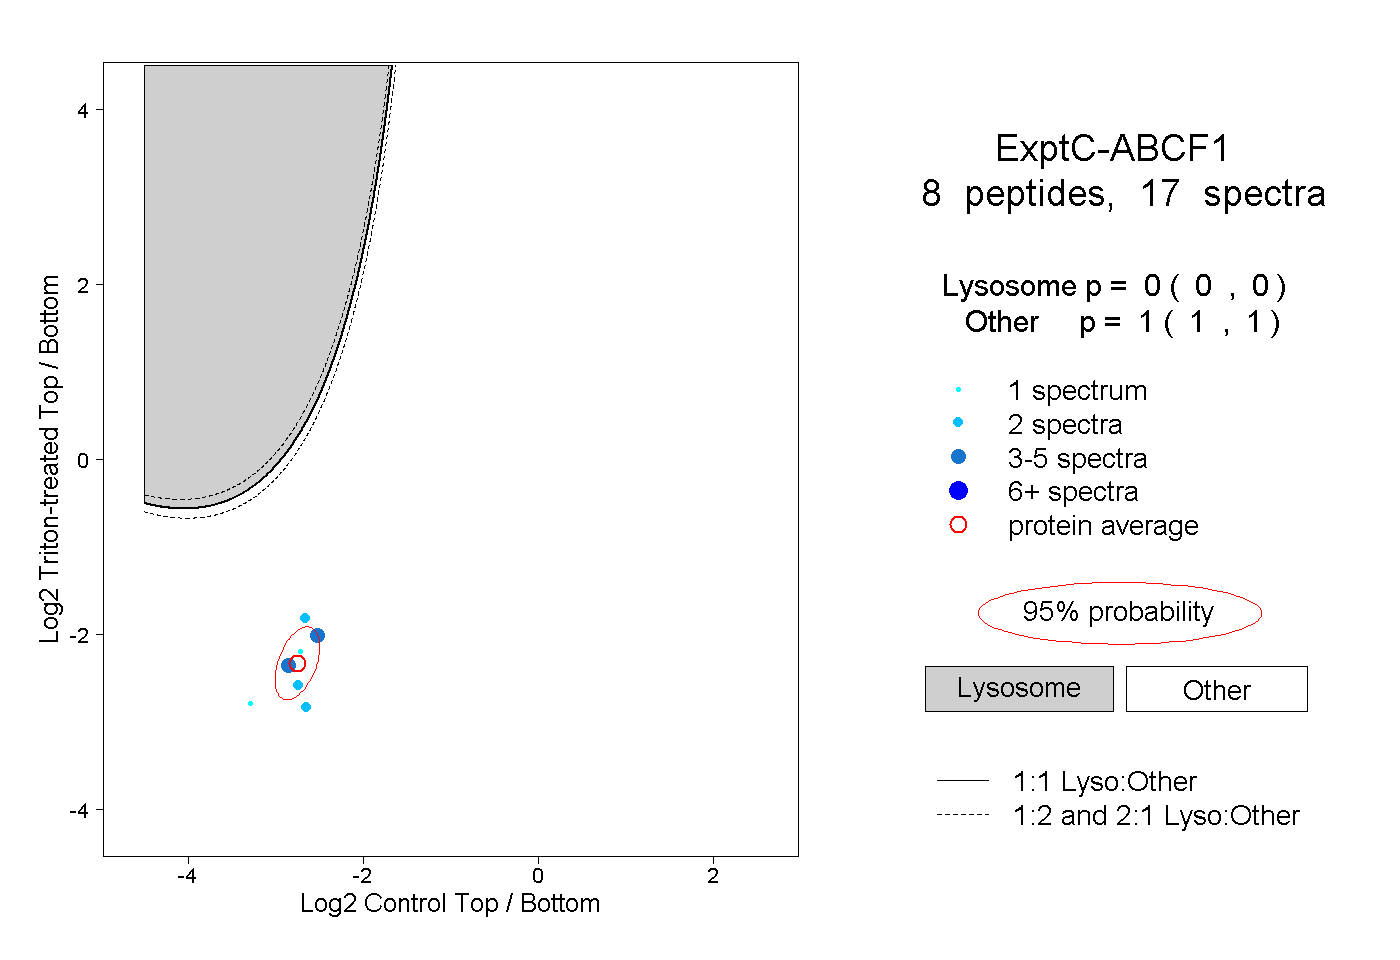
Lyso |
|
|
|
|
|
|
|
Other |
| Expt C |
8
peptides |
17
spectra |
 |
|
0.000
0.000 | 0.000 |
|
|
|
|
|
|
|
1.000
1.000 | 1.000 |
| | | Plot |
|
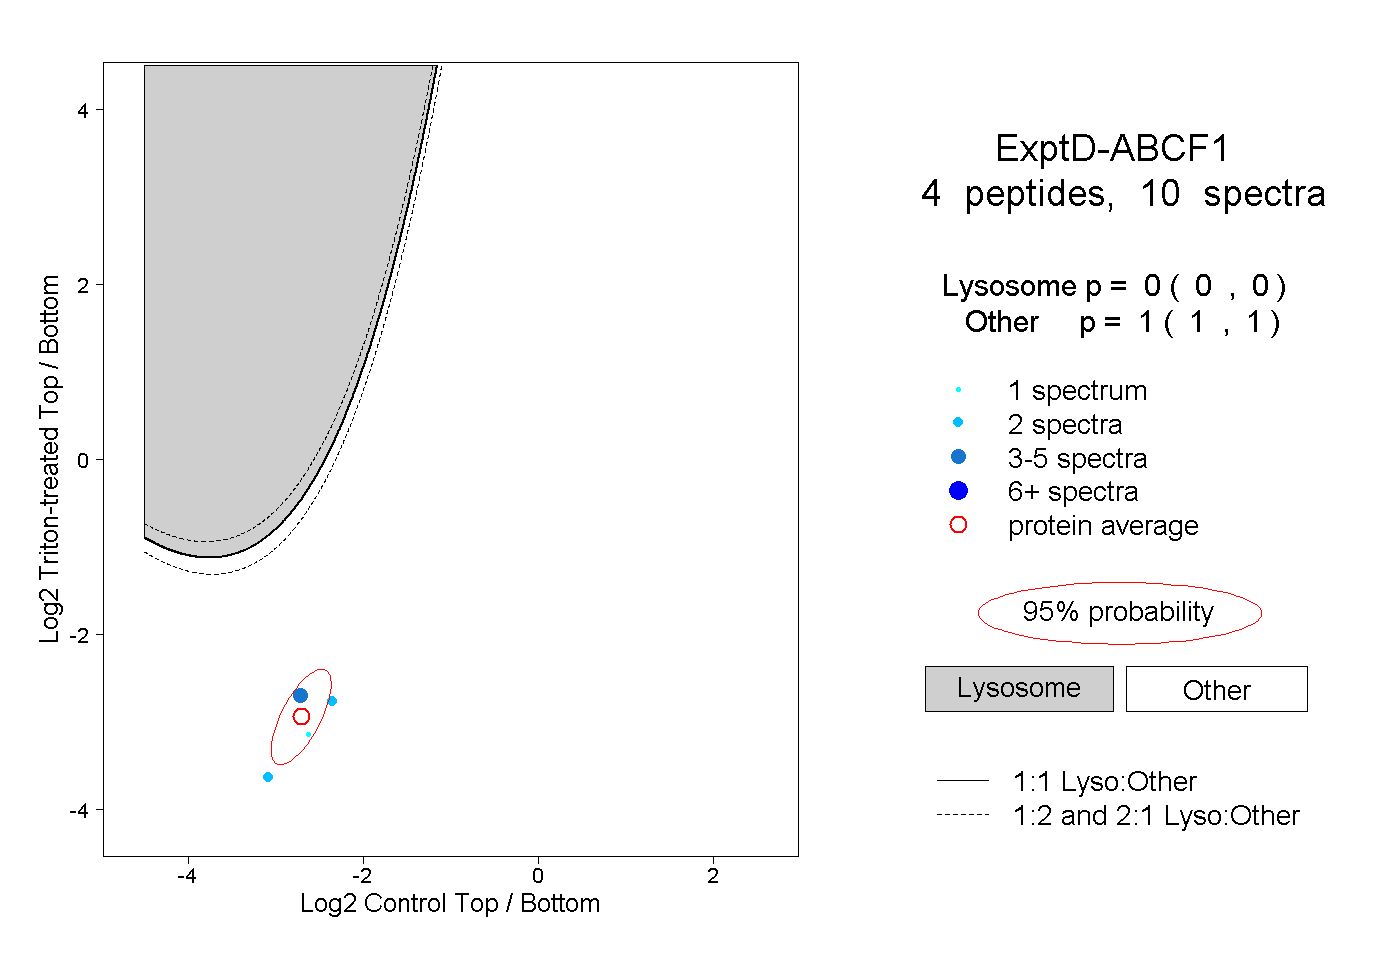
Lyso |
|
|
|
|
|
|
|
Other |
| Expt D |
4
peptides |
10
spectra |
 |
|
0.000
0.000 | 0.000 |
|
|
|
|
|
|
|
1.000
1.000 | 1.000 |