 6
6peptides
spectra
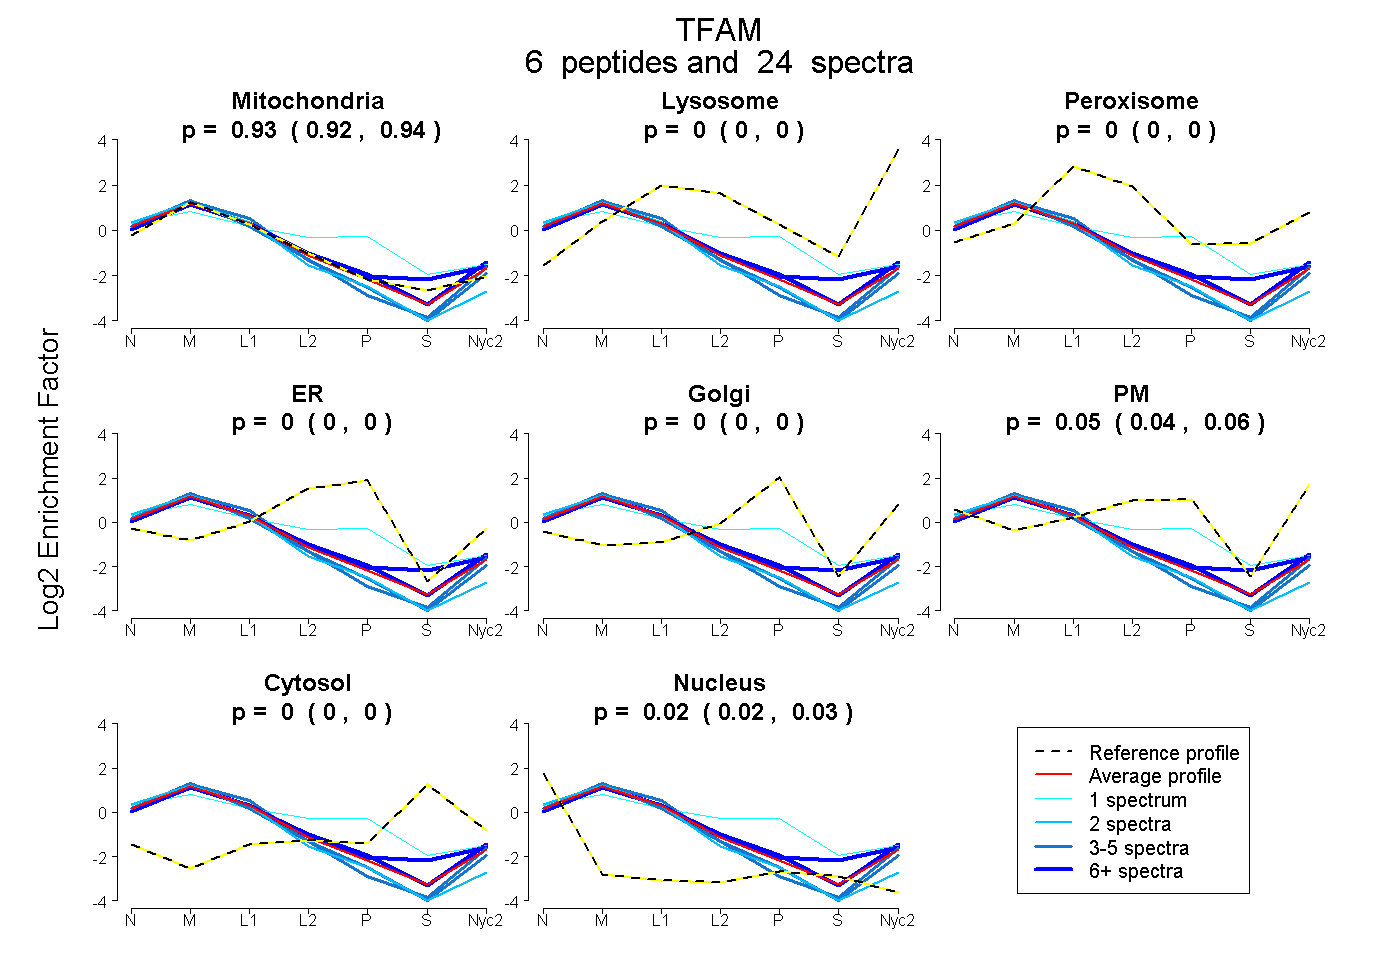
0.920 | 0.939
0.000 | 0.000
0.000 | 0.000
0.000 | 0.000
0.000 | 0.000
0.037 | 0.057
0.000 | 0.000
0.018 | 0.026
4peptides
spectra
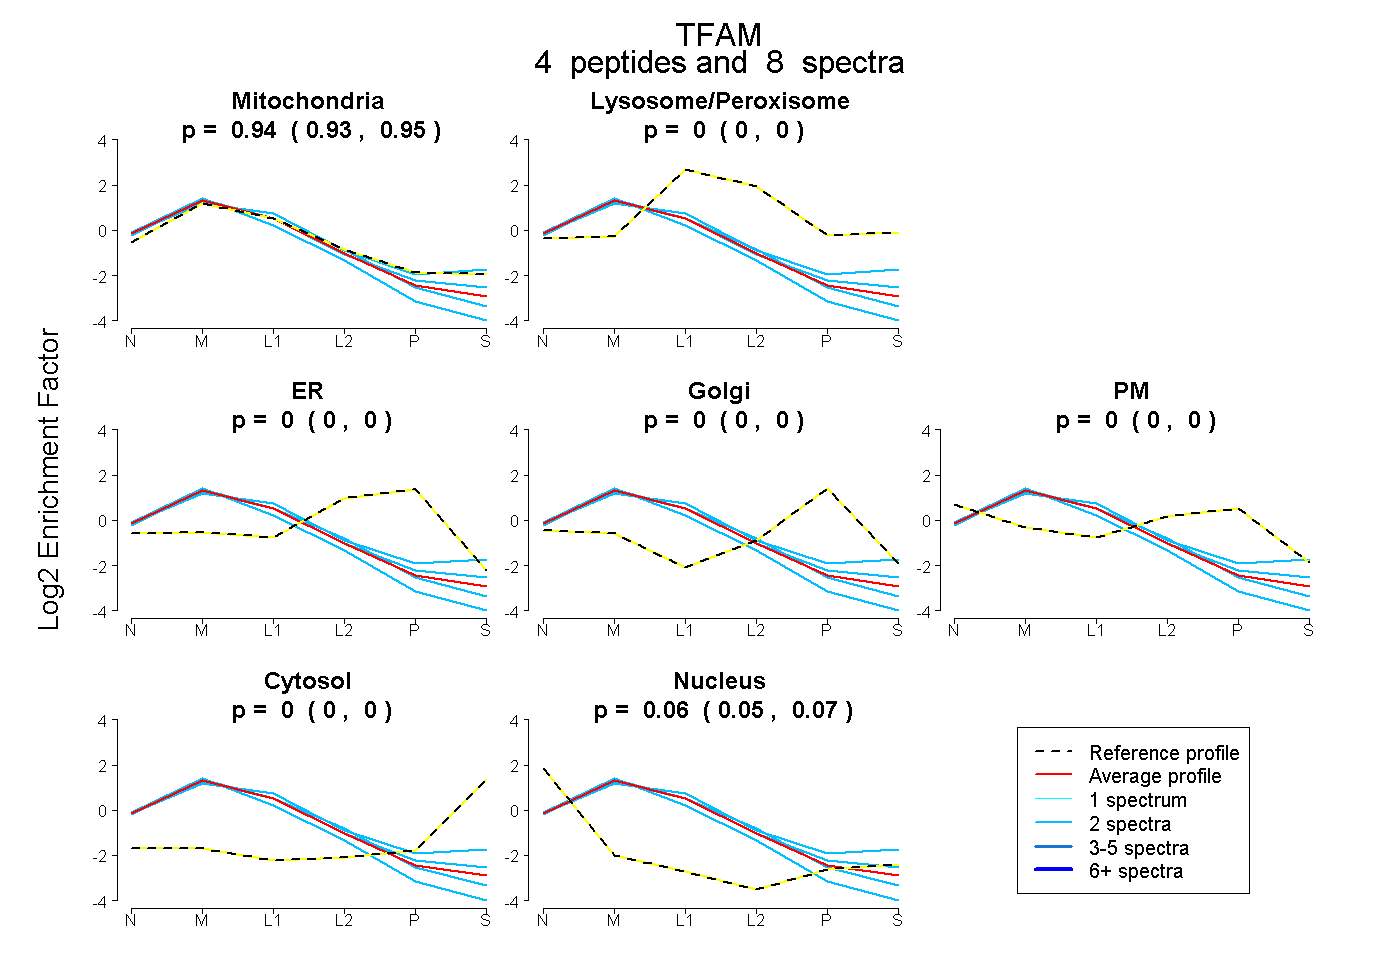
0.930 | 0.952
0.000 | 0.000
0.000 | 0.000
0.000 | 0.000
0.000 | 0.000
0.000 | 0.000
0.047 | 0.068
12peptides
spectra
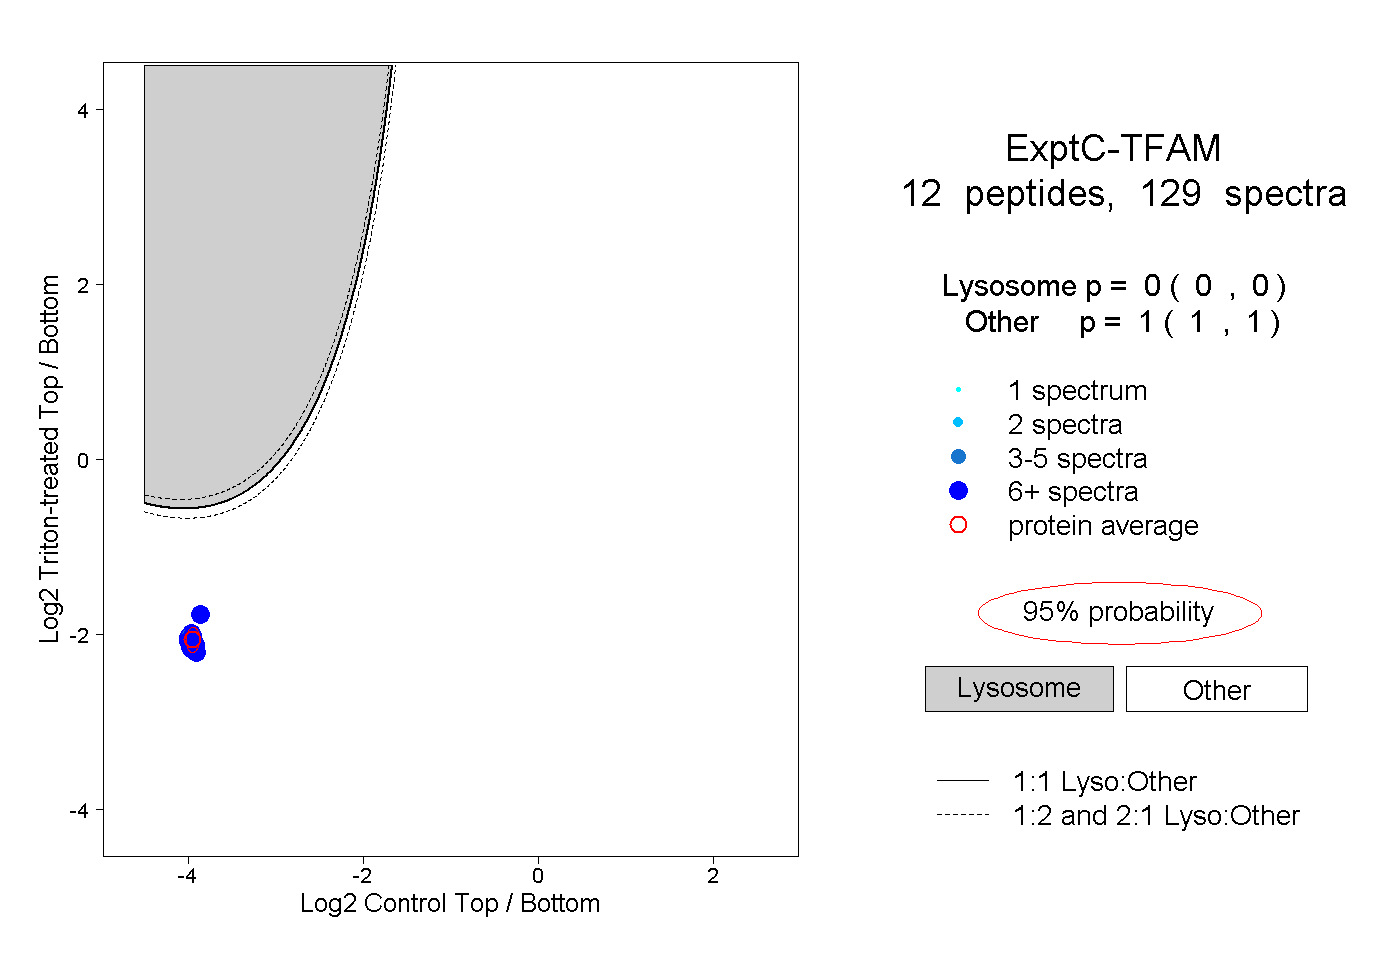
0.000 | 0.000
1.000 | 1.000
6peptides
spectra

0.000 | 0.000
1.000 | 1.000