 6
6peptides
spectra
0.920 | 0.939
0.000 | 0.000
0.000 | 0.000
0.000 | 0.000
0.000 | 0.000
0.037 | 0.057
0.000 | 0.000
0.018 | 0.026
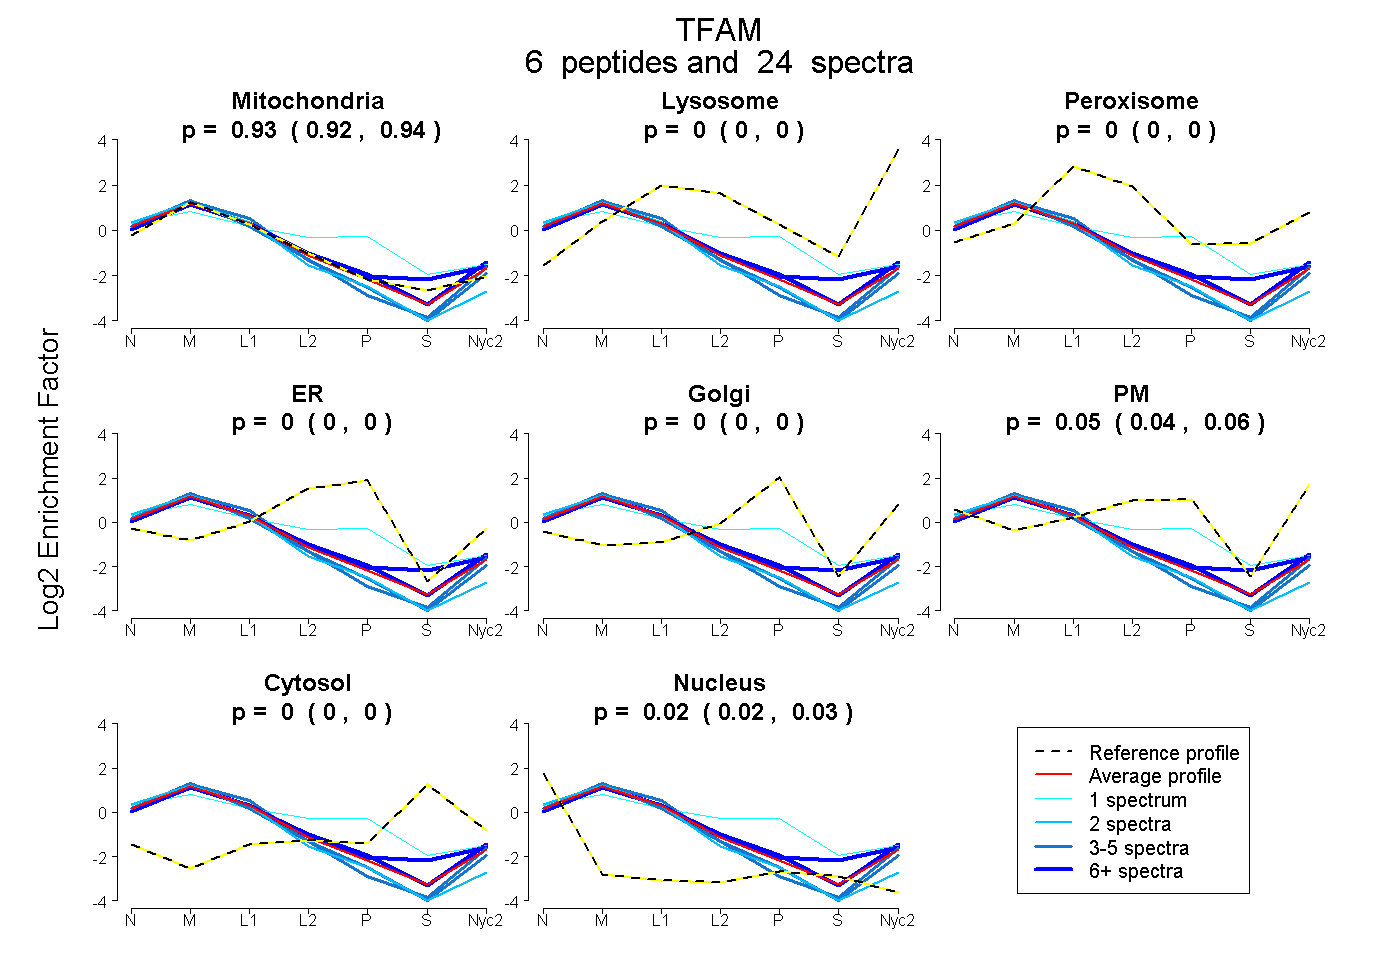
| Plot | Mito | Lyso | Perox | ER | Golgi | PM | Cytosol | Nucleus | |||||
| Expt A |
6 peptides |
24 spectra |
|
0.930 0.920 | 0.939 |
0.000 0.000 | 0.000 |
0.000 0.000 | 0.000 |
0.000 0.000 | 0.000 |
0.000 0.000 | 0.000 |
0.048 0.037 | 0.057 |
0.000 0.000 | 0.000 |
0.022 0.018 | 0.026 |
| 3 spectra, VSELIR | 0.964 | 0.000 | 0.000 | 0.000 | 0.000 | 0.000 | 0.000 | 0.036 | ||
| 1 spectrum, QAYIQLAK | 0.598 | 0.000 | 0.034 | 0.286 | 0.050 | 0.007 | 0.018 | 0.005 | ||
| 4 spectra, KPMSSYLR | 0.981 | 0.000 | 0.000 | 0.000 | 0.000 | 0.000 | 0.000 | 0.019 | ||
| 2 spectra, VYEADFK | 0.906 | 0.000 | 0.000 | 0.000 | 0.000 | 0.000 | 0.000 | 0.094 | ||
| 6 spectra, SWEEQMAEVGR | 0.867 | 0.024 | 0.039 | 0.000 | 0.000 | 0.015 | 0.034 | 0.022 | ||
| 8 spectra, IAAMWR | 0.903 | 0.000 | 0.000 | 0.000 | 0.000 | 0.097 | 0.000 | 0.000 |
| Plot | Mito | Lyso or Perox | ER | Golgi | PM | Cytosol | Nucleus | ||||||
| Expt B |
4 peptides |
8 spectra |
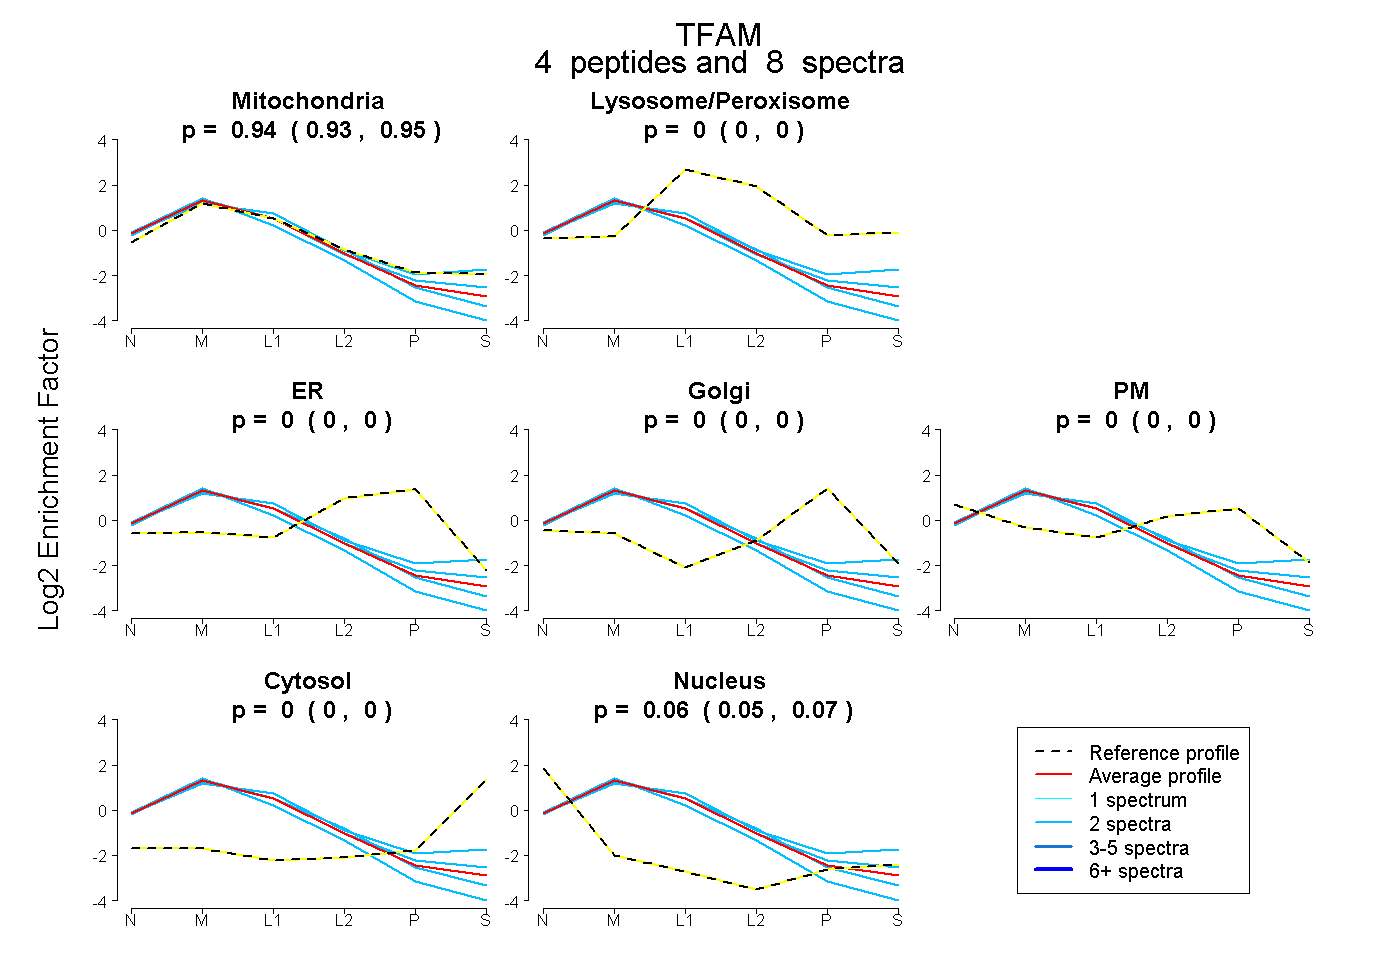 |
0.942 0.930 | 0.952 |
0.000 0.000 | 0.000 |
0.000 0.000 | 0.000 |
0.000 0.000 | 0.000 |
0.000 0.000 | 0.000 |
0.000 0.000 | 0.000 |
0.058 0.047 | 0.068 |
|||
| Plot | Lyso | Other | |||||||||||
| Expt C |
12 peptides |
129 spectra |
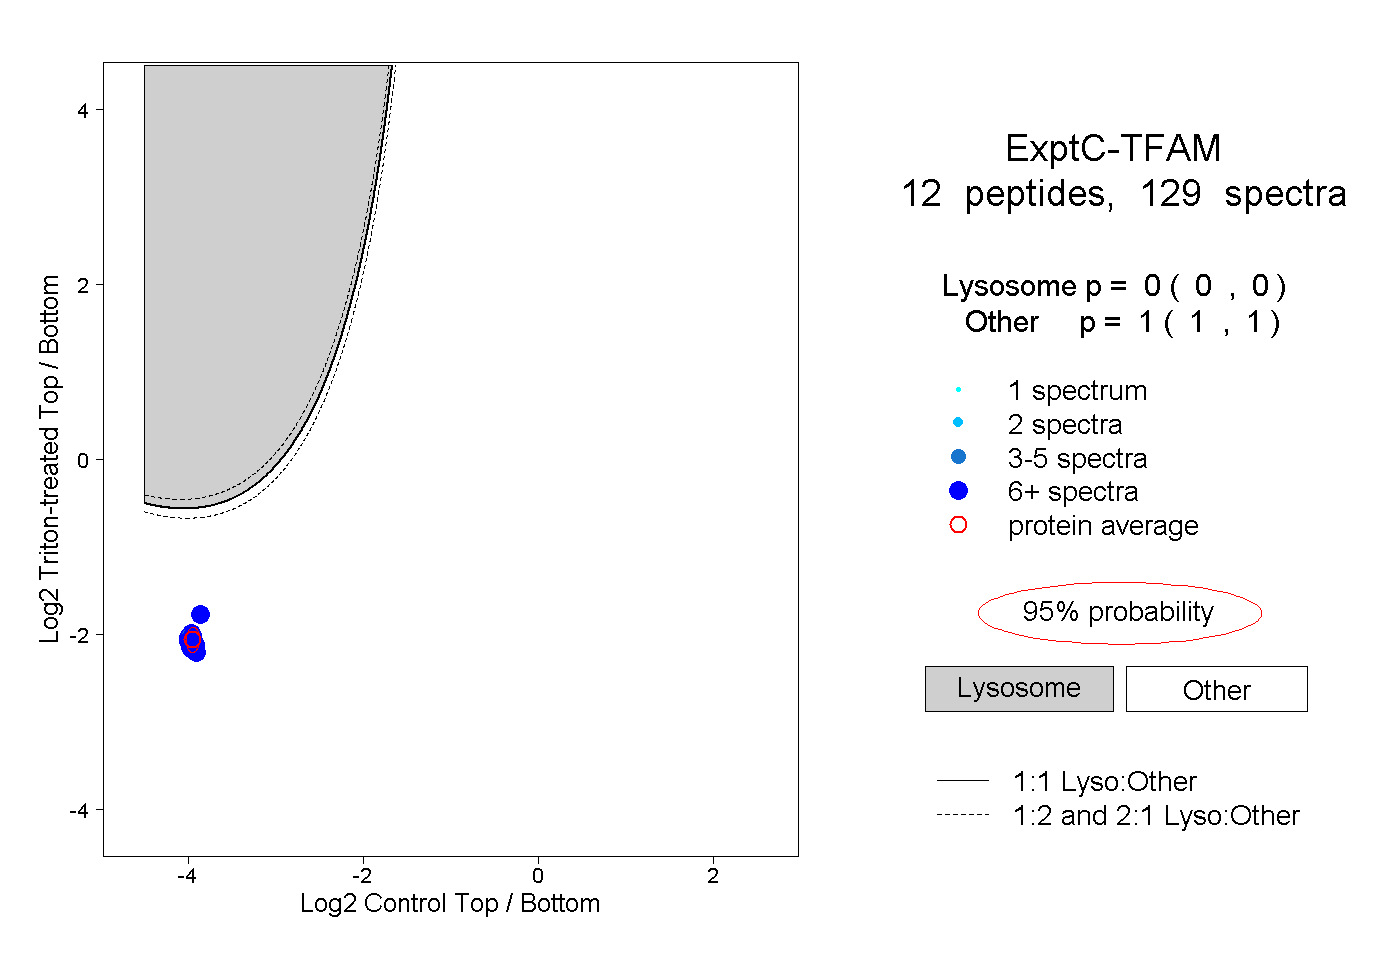 |
0.000 0.000 | 0.000 |
1.000 1.000 | 1.000 |
||||||||
| Plot | Lyso | Other | |||||||||||
| Expt D |
6 peptides |
21 spectra |
 |
0.000 0.000 | 0.000 |
1.000 1.000 | 1.000 |