 3
3peptides
spectra
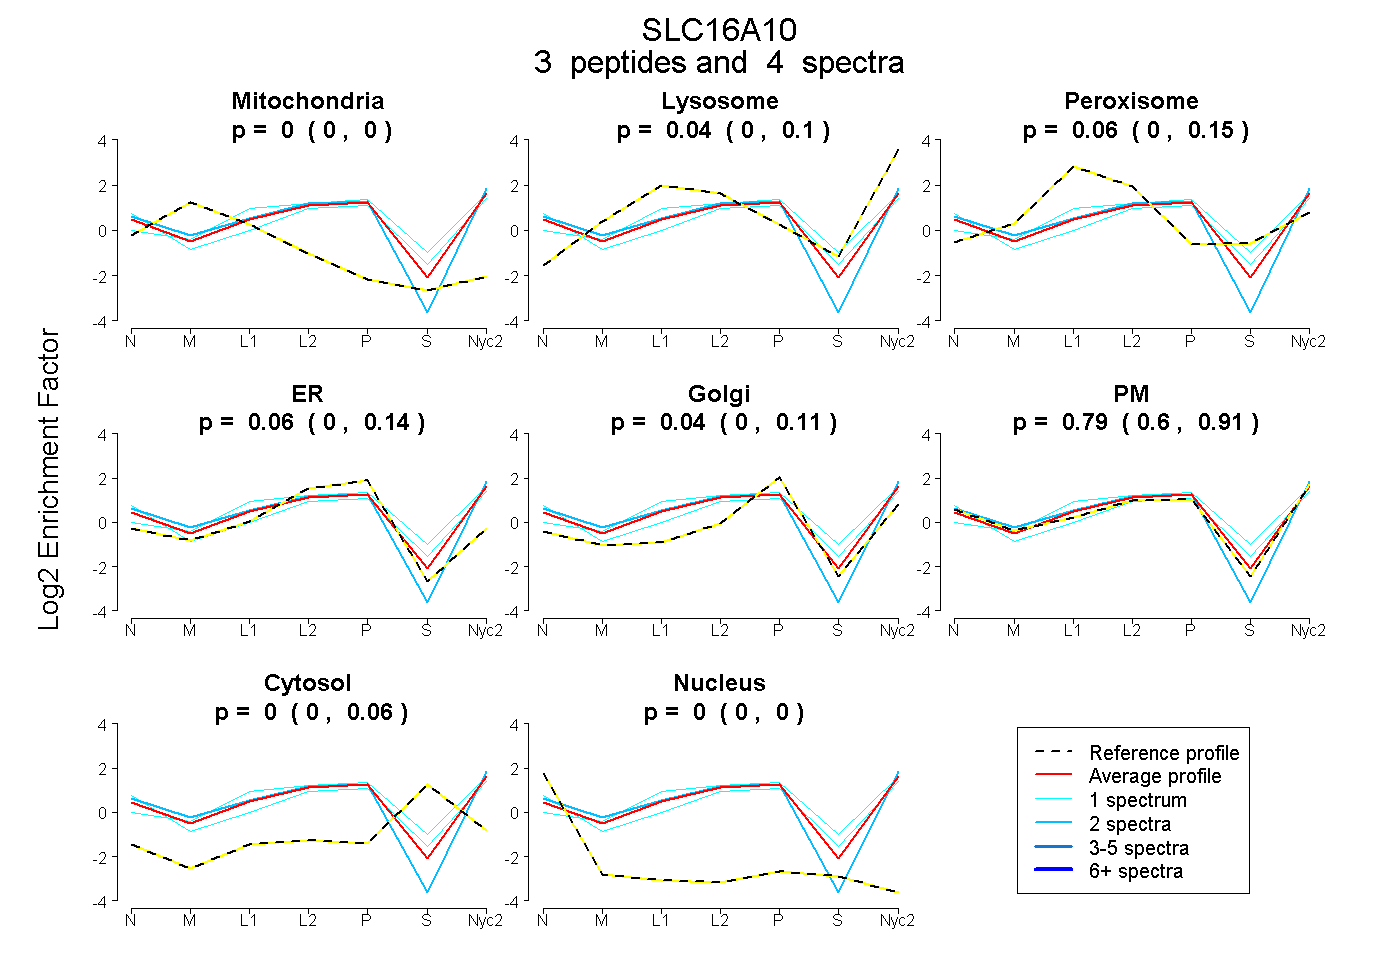
0.000 | 0.000
0.000 | 0.104
0.000 | 0.150
0.000 | 0.145
0.000 | 0.111
0.605 | 0.909
0.000 | 0.062
0.000 | 0.000
1peptide
spectra
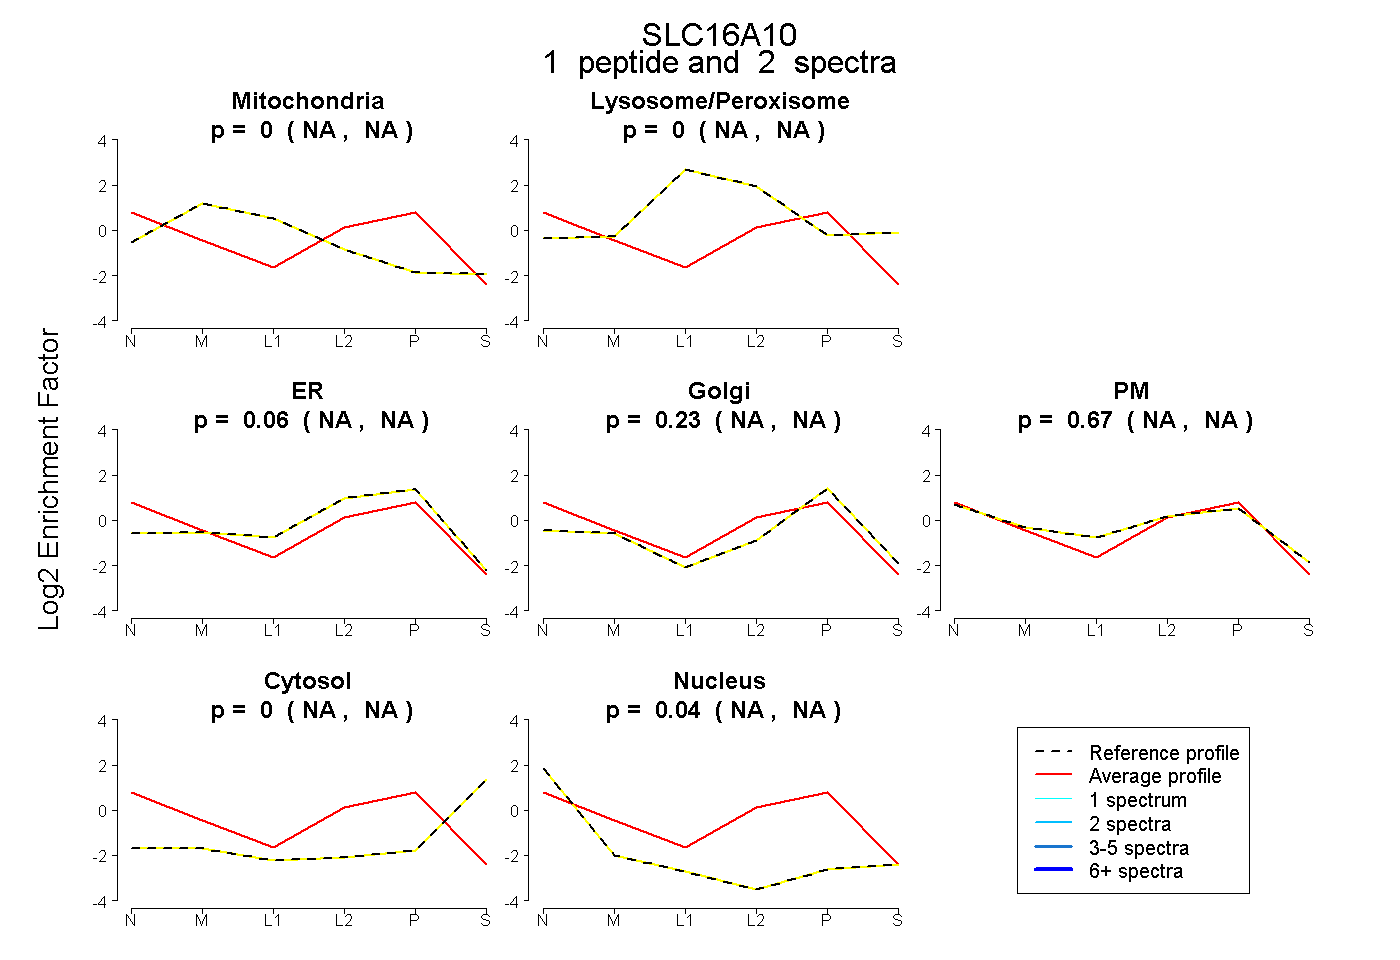
NA | NA
NA | NA
NA | NA
NA | NA
NA | NA
NA | NA
NA | NA
2peptides
spectra
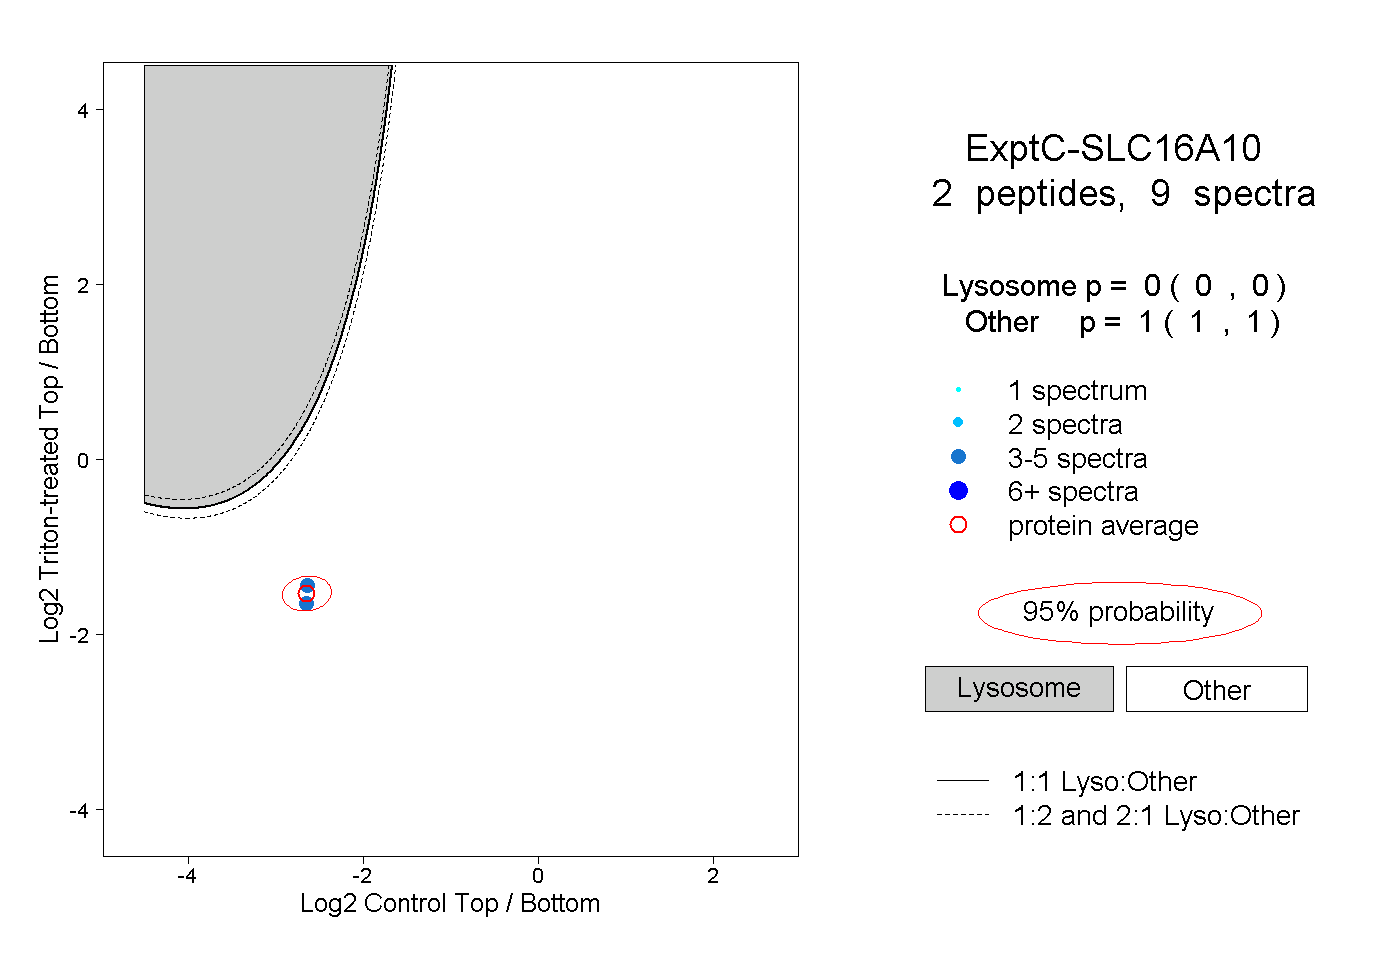
0.000 | 0.000
1.000 | 1.000