 3
3peptides
spectra
0.000 | 0.000
0.000 | 0.104
0.000 | 0.150
0.000 | 0.145
0.000 | 0.111
0.605 | 0.909
0.000 | 0.062
0.000 | 0.000
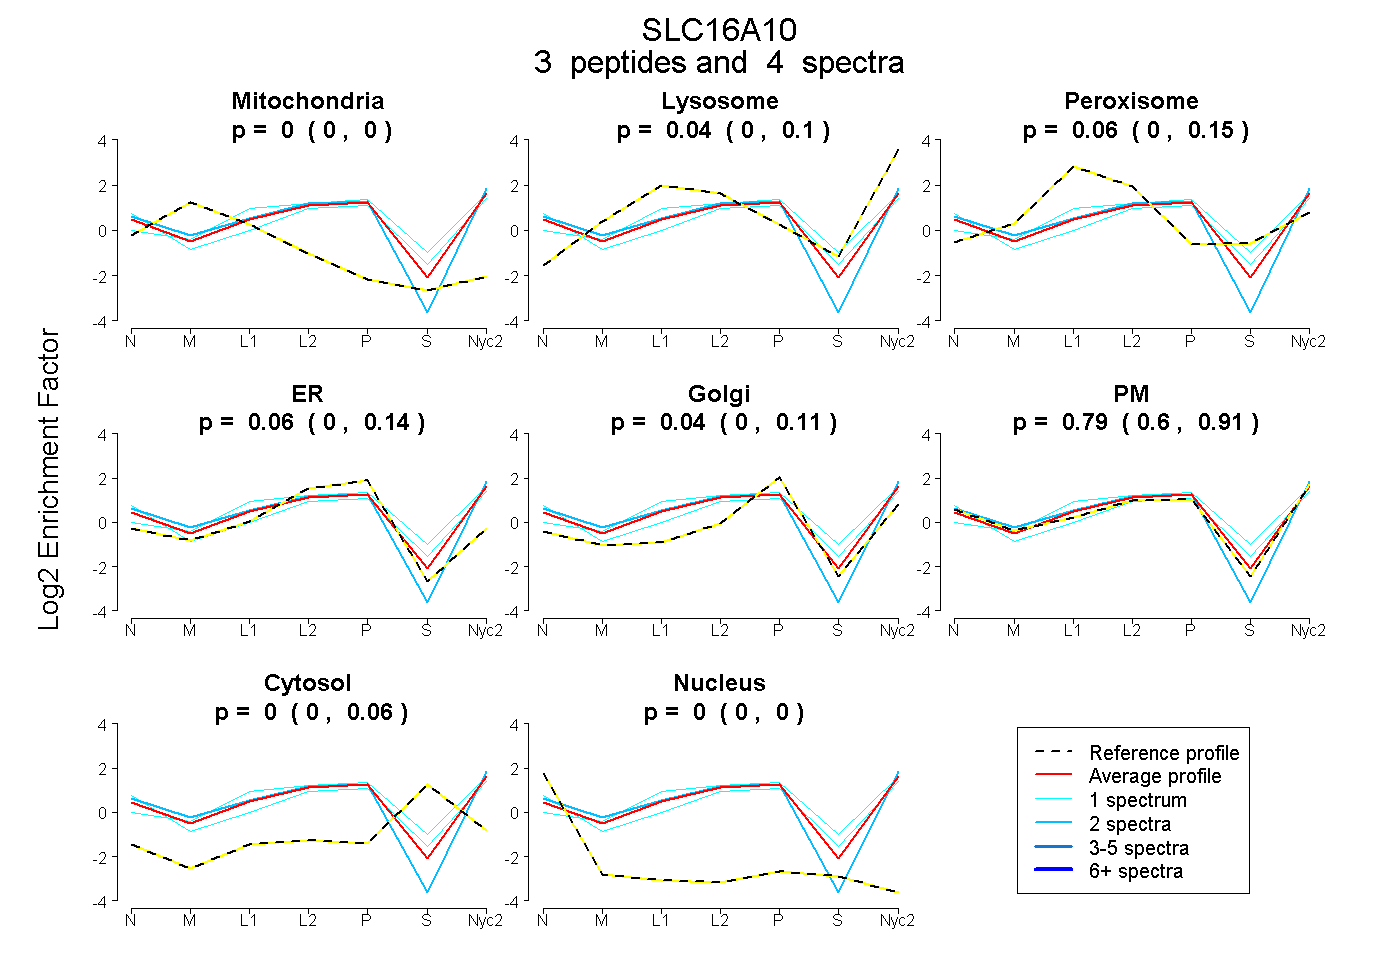
| Plot | Mito | Lyso | Perox | ER | Golgi | PM | Cytosol | Nucleus | |||||
| Expt A |
3 peptides |
4 spectra |
|
0.000 0.000 | 0.000 |
0.040 0.000 | 0.104 |
0.065 0.000 | 0.150 |
0.064 0.000 | 0.145 |
0.037 0.000 | 0.111 |
0.794 0.605 | 0.909 |
0.000 0.000 | 0.062 |
0.000 0.000 | 0.000 |
| 2 spectra, SSFFSR | 0.000 | 0.000 | 0.000 | 0.020 | 0.000 | 0.980 | 0.000 | 0.000 | ||
| 1 spectrum, ESDSII | 0.000 | 0.000 | 0.000 | 0.004 | 0.000 | 0.872 | 0.124 | 0.000 | ||
| 1 spectrum, MLANQSSLLSSSSGIFK | 0.000 | 0.166 | 0.282 | 0.000 | 0.303 | 0.249 | 0.000 | 0.000 |
| Plot | Mito | Lyso or Perox | ER | Golgi | PM | Cytosol | Nucleus | ||||||
| Expt B |
1 peptide |
2 spectra |
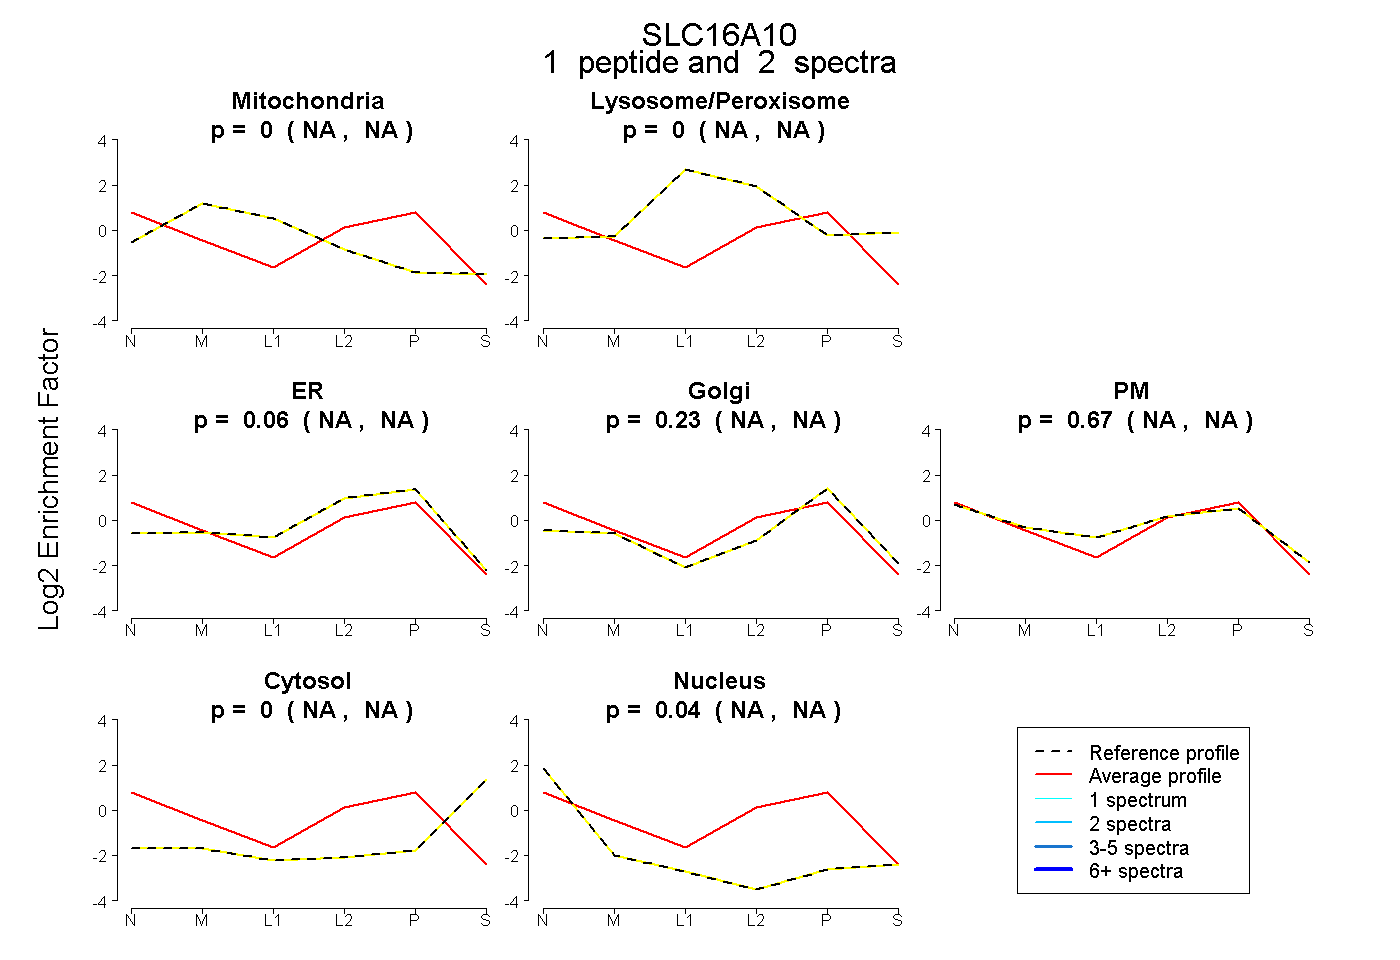 |
0.000 NA | NA |
0.000 NA | NA |
0.058 NA | NA |
0.230 NA | NA |
0.668 NA | NA |
0.000 NA | NA |
0.044 NA | NA |
|||
| Plot | Lyso | Other | |||||||||||
| Expt C |
2 peptides |
9 spectra |
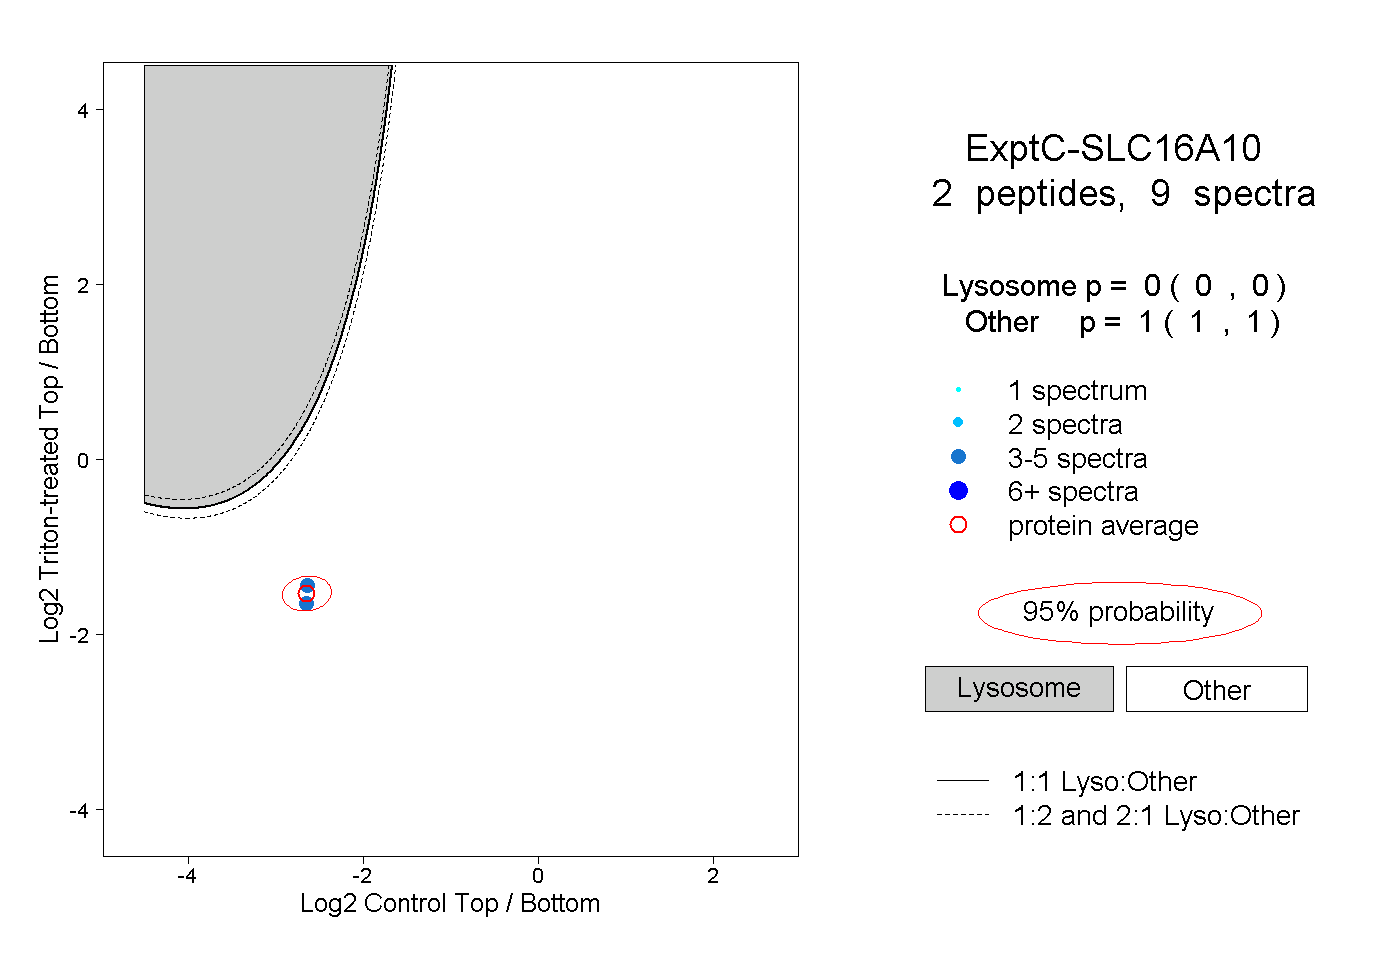 |
0.000 0.000 | 0.000 |
1.000 1.000 | 1.000 |